

Counting carbon –
Annual update shows a smaller increase in 2019 Compared to last year.
Enlarge/Bar graph of climate data.
Large oceangoing ships turn very slowly, which can be frustrating to someone accustomed to speeding around on nimble watercraft. Those eagerly watching for progress on climate change can relate. Every year, another batch of stats on greenhouse gas emissions comes in, and we’re left to wonder whether we’re turning things around yet.
This year update was just published as part of theGlobal Carbon Project– a large scientific collaboration that coordinates this difficult accounting work. The researchers compile the latest estimates for every component of Earth’s carbon cycle, from fossil fuel emissions and deforestation to the uptake of carbon by the ocean and vegetation.
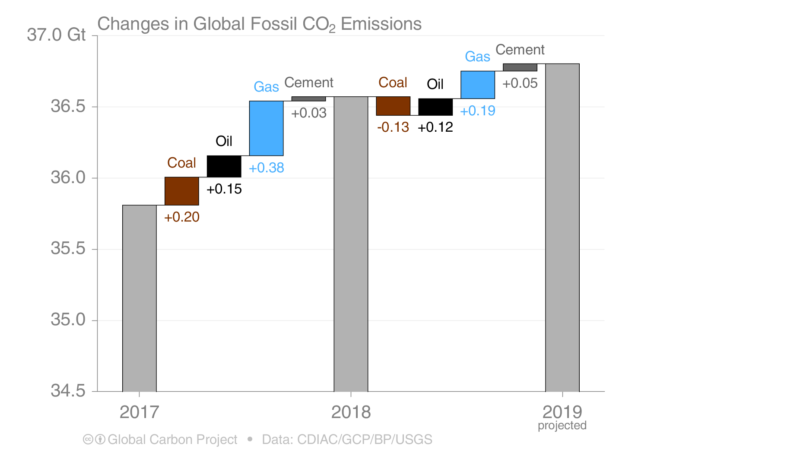
The topline numbers are the total global emissions estimates. As this is published before the end of the year, the report includes a preliminary estimate for 2019 and a revision to the 2018 numbers publishedlast year. Estimated 2018 emissions come in at a 2.1 percent increase over 2017 – well within the error bars of last year preliminary estimate of 2.7 percent.
The preliminary number for 2019, which relies on available data through about mid-November , sees a smaller increase of 0.6 percent (-0.2 to 1.5 percent) this year.
Thestudyincludes global trends for each type of fuel in 2019. Overall, coal use is seeing a drop of about 0.9 percent, while oil is up 0.9 percent, natural gas is up 2.6 percent, and direct emissions from cement production are up about 3.7 percent.
Twootherpaperspublishedat the same time discuss these trends from a big-picture perspective. Increasing access to vehicles around the world is leading to more miles driven and more oil use, despite the nascent growth of electric vehicles. And liquefied natural gas exports from countries like the United States and Australia are driving natural gas prices down and increasing its use. Coal, meanwhile, is losing share almost everywhere.
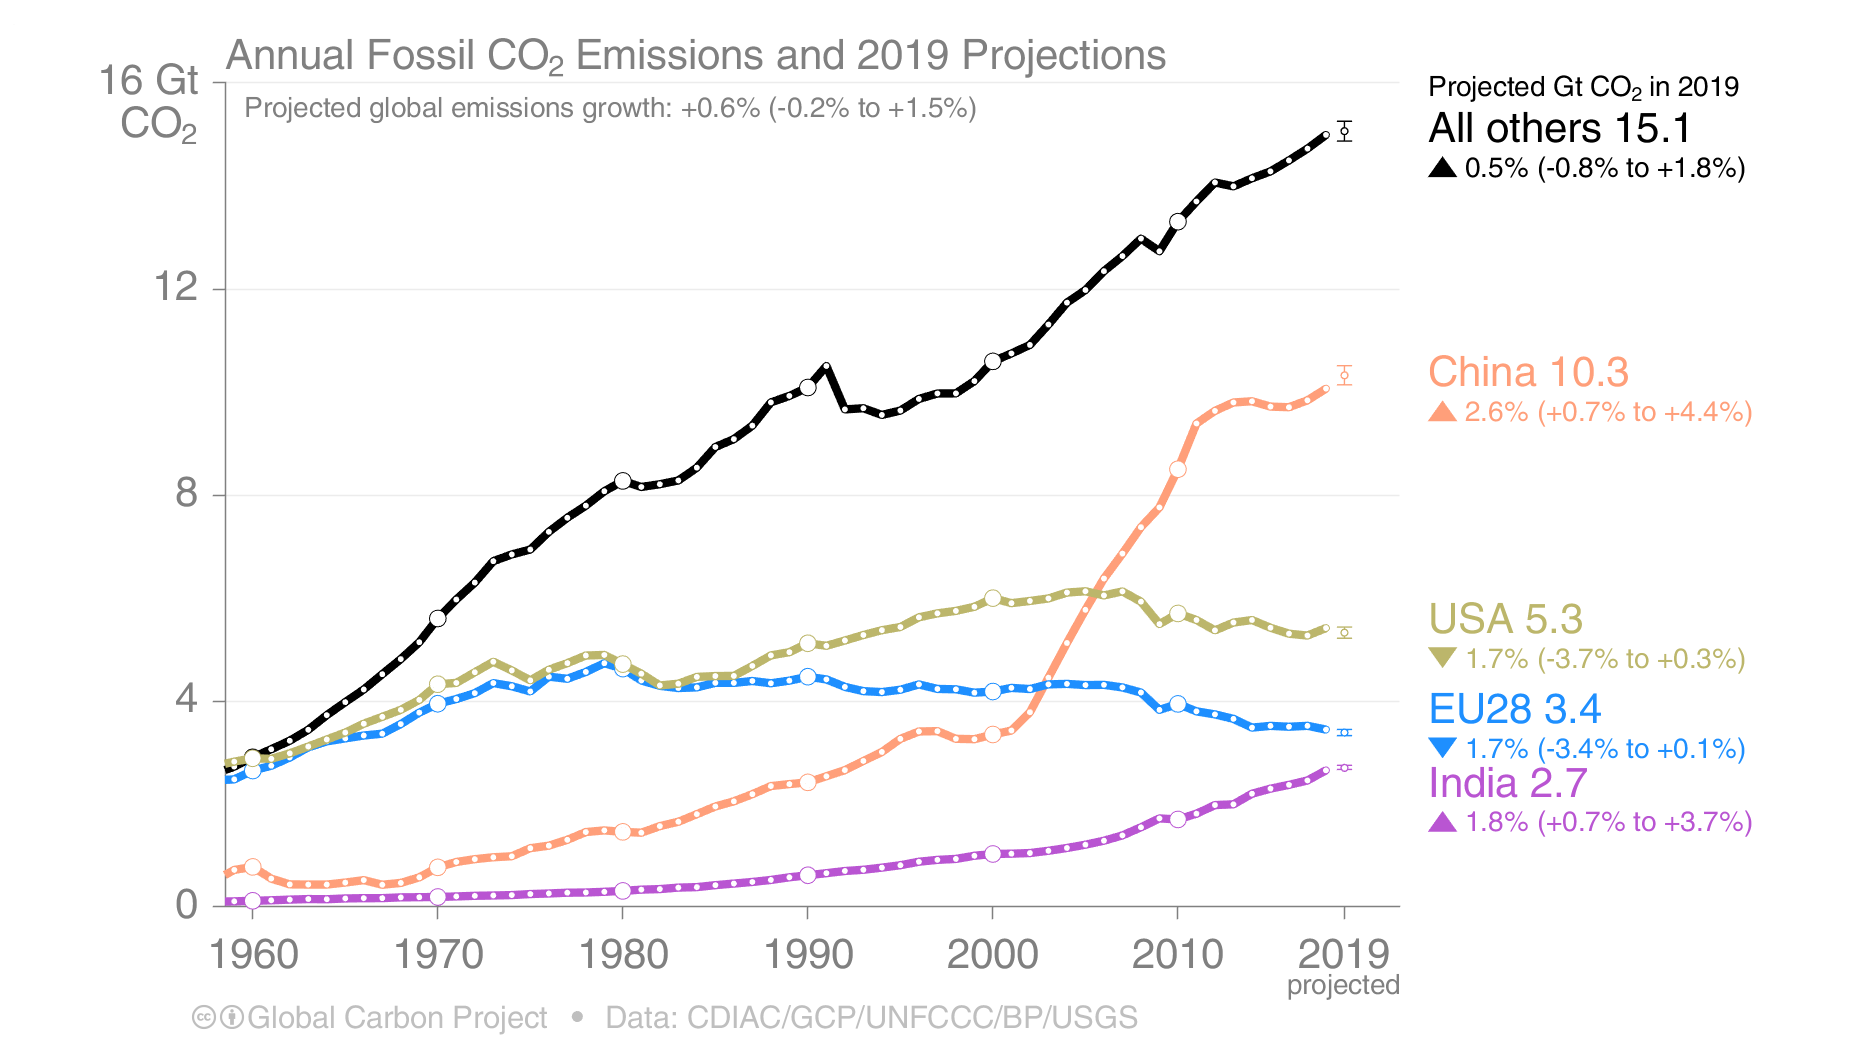
Looking at the biggest emitters, preliminary estimates have China’s emissions increasing by 2.6 percent, a drop from last year 4.7 percent bump . Despiteencouraging signsthat China’s peak could be near, it hasn’t happened yet. Within the country, coal use was roughly constant, but oil rose 6.9 percent and natural gas rose 9.1 percent.
In the US, last year anomalous 2.5 percent increase is set to be followed by a 1.7 percent drop. That was brought on by a remarkable 10 .5 percent drop in coal, while natural gas rose 3.5 percent. As it happens, those 2019 numbers are matched almost exactly by the EU (still including the UK for now).
India, on the other hand, also had an unusual year, with just a 1.8 percent increase after 6.3 percent emission growth in 2018. This is partly due to slow economic growth and partly due to a heavy monsoon season that actually flooded coal mines while boosting the output of hydroelectric dams.
The rest of the world’s emissions increased just 0.5 percent — less than the 1.8 percent increase in 2018.
One of theaccompanyingpapers projects these trends forward to take a guess at 2020 ‘s global emission. “Global CO2emissions appear poised to rise again in 2020, “the authors write. “Global consumption of natural gas is surging, only partially replacing coal use in the United States and European Union. Global energy use also continues to rise. Global GDP is projected to grow by 3.0 percent in 2020 , and the global energy system is far from fully decarbonized. In consequence, energy growth still contributes additional CO2emissions — despite the rise of renewable fuels as the lowest-cost source of new power in most places today — because the carbon intensity of global energy production has yet to fall. “
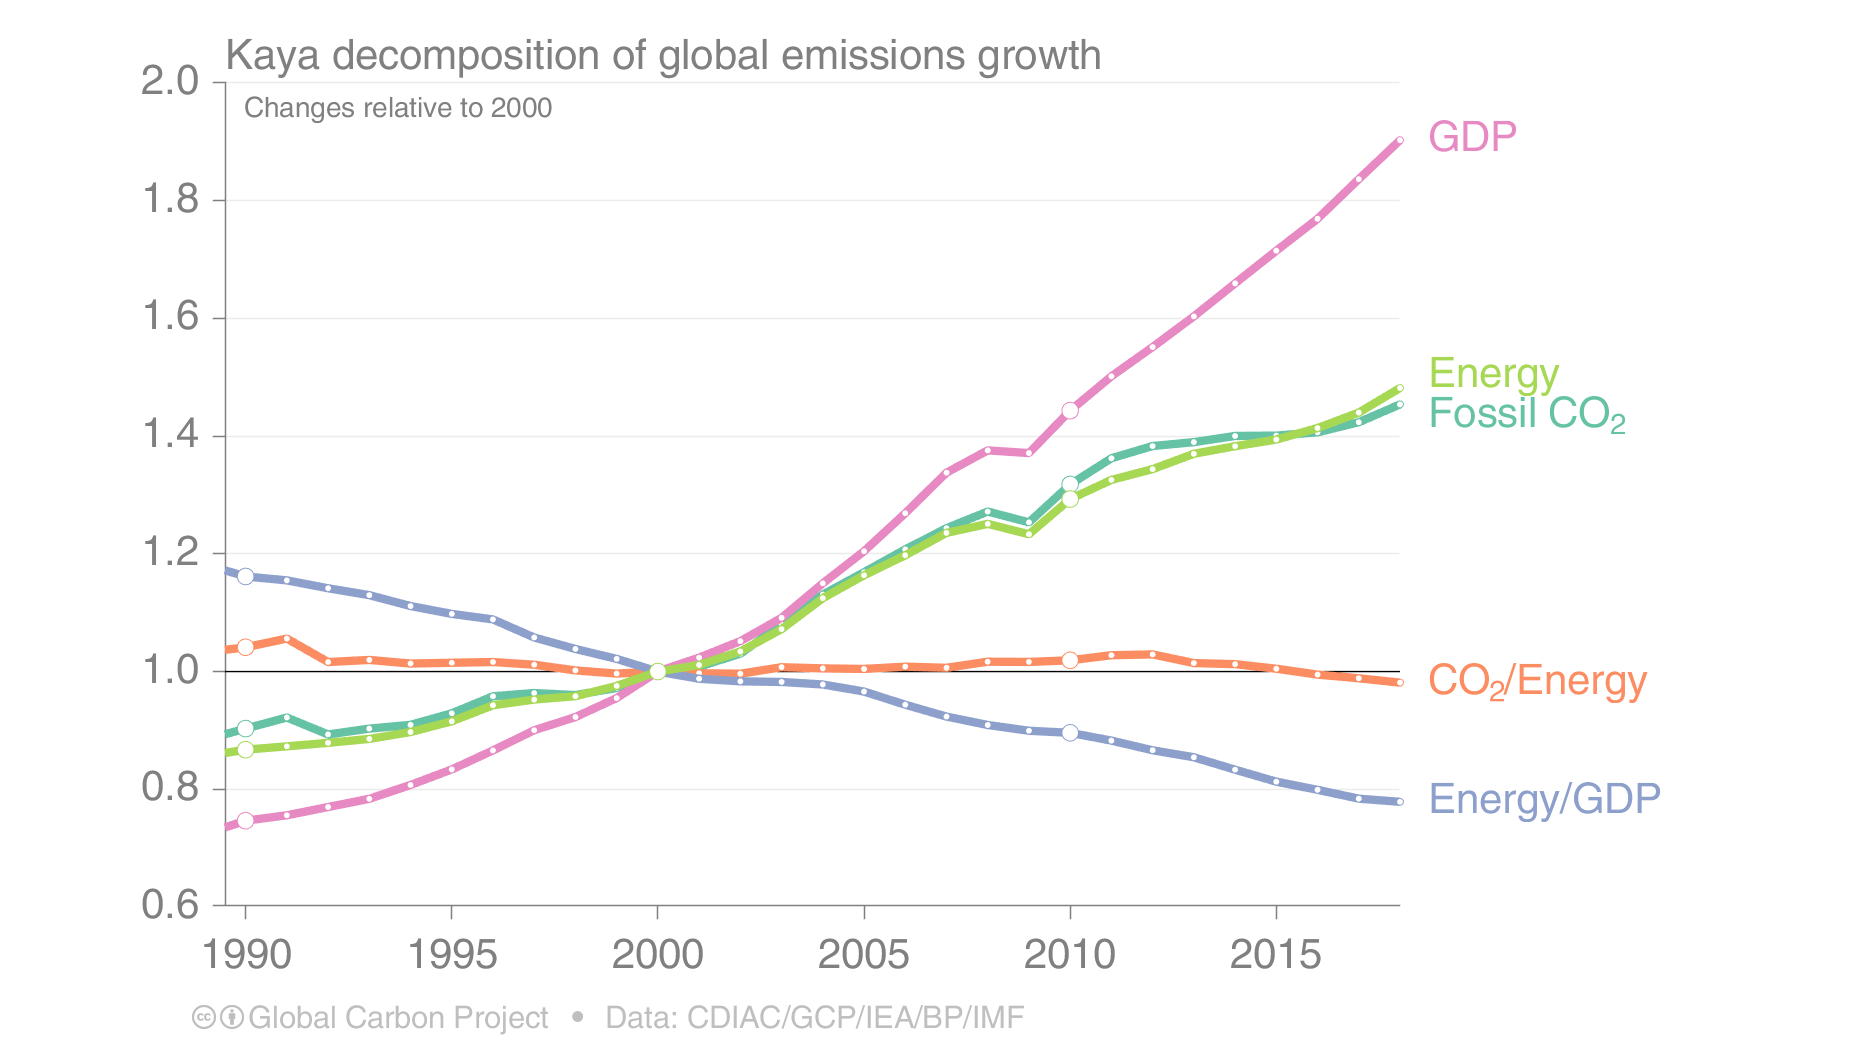
Enlarge/One way to break down emissions drivers: economic output (GDP), energy use per unit of GDP, and carbon emissions per unit of energy.
concentration of CO2in the atmosphere, of course,continues to increaseas our emissions continue. Because of the way Earth’s carbon cycle works, the researchers note that even a sustained 1-percent-per-year decrease in global emissions would take around a decade to have a clear impact on atmospheric measurements. That means the ultimate proof that our ship is turning will take even longer to manifest. But before we can worry about that, we have to actually turn the wheel. The latest numbers show we’re not there yet.
Environmental System Science Data, 2019. DOI:. 5194 / essd – 11 – 1783 – 2019,
Nature Climate Change, 2019. DOI:. 1038 / s 41558 – – 0659 – 6,
Environmental Research Letters, 2019. DOI:. 1088 / 1748 – 9326 / AB 57 B3(About DOIs).


GIPHY App Key not set. Please check settings