
In a news article on Vox, entitled “Installing air filters in classrooms has surprisingly large educational benefits,” Matthew Yglesiaswrites:
An emergency situation that turned out to be mostly a false alarm led a lot of schools in Los Angeles to install air filters, and something strange happened: Test scores went up. By a lot. And the gains were sustained in the subsequent year rather than fading away.
That’s what NYU’s Michael Gilraine finds in a new working paper titled “Air Filters, Pollution, and Student Achievement” that looks at the surprising consequences of theAliso Canyon gas leakin 2017. . . .
If Gilraine’s result holds up to further scrutiny, he will have identified what’s probably the single most cost-effective education policy intervention – one that should have particularly large benefits for low-income children. . . .
He finds that math scores went up by 0. 28 standard deviations and English scores by 0. 20 standard deviations, and the results hold up even when you control for “detailed student demographics, including residential ZIP Code fixed effects that help control for a student’s exposure to pollution at home.”
I clicked through thelink, and I don’t believe it. Not the thing about air filters causing large improvements in test scores — I mean, I’m sure, I’m skeptical of claims of large effects, but really I have no idea about what’s going on with air pollution and the brain — no, what I don ‘t believe is that the study in question provides the claimed evidence.
Here’s the key graph from the paper:
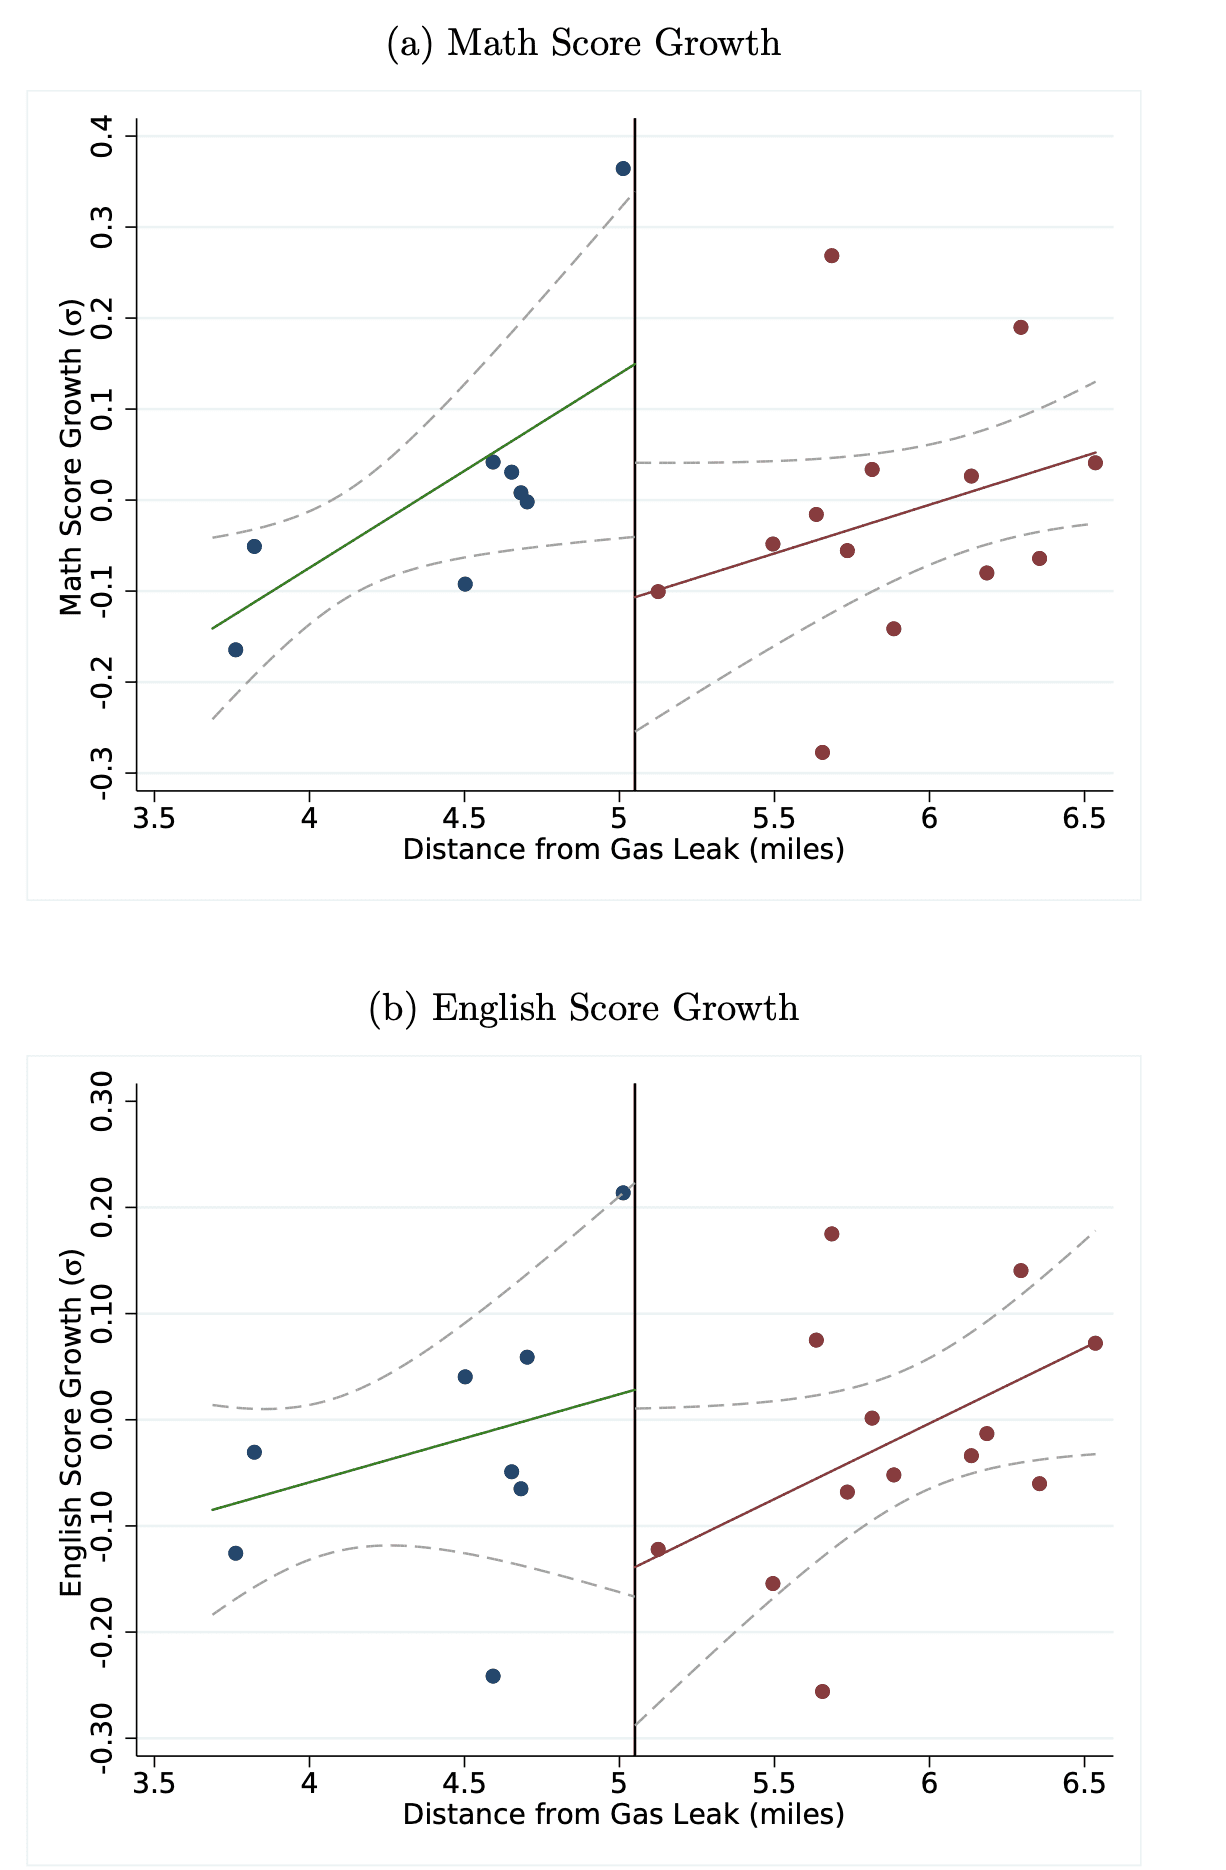
The whole thing is driven by one data point and a linear trend which makes no theoretical sense in the context of the paper (from the abstract: “Air testing conducted inside schools during the leak (but before air filters were installed) showed no presence of natural gas pollutants, implying that the effectiveness of air filters came from removing common air pollutants ”) but does serve to create a background trend to allow a big discontinuity with some statistical significance.
We’ve been down this road before. When we discussed itearlier(see alsohere) it was in the context of high-degree polynomials, but really it’s a moregeneral problemwith analysis of observational data.
Given what we know about statistics, how should we think about this problem?
It goes like this: The installation of air filters can be considered as a natural experiment, so the first step is to compare results in schools in the area with and without air filters: in statistics terms, a regression with one data point per school, with the outcome being average post-test score and the predictors being average pre-test score and an indicator for air filters. Make a scatterplot of post-test vs. pre-test with one point per school, displaying treated schools as open circles and control schools as dots. Make a separate estimate and graph for each grade level if you’d like, but I’m guessing that averages will give you all the information you need. Similarly, you can do a multilevel model using data from individual students — why not, it’s easy enough to do — but I don’t think it will really get you much of anything beyond the analysis of school-level averages. If you know the local geography, that’s great, and to gain insight you could make plots of pre-test scores, post-test scores, and regression residuals on a map, using color intensities. I don’t know that this will reveal much either, but who knows. I’d also include the schools in the neighborhood that were not part of the agreement (see caption of figure 1 in the linked paper).
I’m not saying that the proposed analysis plan is perfect or anything like it; It’s a starting point. If you take the above graphs and ignore the distracting lines on them, you won’t see much — it all pretty much looks like noise, which is no surprise given the variability of test scores and the variability among schools — but it’s fine to take a look. Observational data analysis is hard, especially when all you have is a small sample, in a small area, at just one time. That’s just the way it is.
What about that regression discontinuity analysis? As noted above, it doesn’t make a lot of sense given the context of the problem, and it’s a bit of a distraction from the challenges of data analysis from an observational study. Just for example, Table 3 reports that they adjust for “a cubic of lagged math and English scores interacted with grade dummies” as well as latitude and longitude ?? Lots of researcher degrees of freedom here. Yes, there are robustness claims, but the result are still being driven by a data-based adjustment which creates that opportunity for the discontinuity.
Again, the point is not that the paper’s substantive conclusion — of the positive effects of air filters on cognitive performance — is wrong, but rather that the analysis presented doesn’t provide any real evidence for that claim. What we see is basically no difference, that becomes a large and possibly statistically significant difference after lots of different somewhat arbitrary knobs are twisted in the analysis. Also, and this is a related point, we should not by default believe this result just because it’s been written up and put on the internet, any more than we should by default believe something published in PNAS. The fact that the analysis includes an identification strategy (in this case, regression discontinuity) does not make it correct, and we have towatch outfor the sort of behavior by which such claims are accepted by default.
What went wrong? What could the reporter have done better?
I don’t want to pick on the author of the above paper, who’s studying an important problem with a unique dataset using generally accepted methods. And it’s just a preprint. It’s good practice for people to release preliminary findings in order to get feedback. Indeed, that’s what’s happening here. That’s the way to go: be open about your design and analysis, share your results, and engage the hivemind. It was good luck to get the publicity right away so now there’s the opportunity to start over on the analysis and accept that the conclusions probably won be so clear, once all is said and done.
If there’s a problem, it’s with the general attitude in much of economics, in which it is assumed that identification strategy statistical significance=discovery. That’s a mistake, and it’s something we have to keep talking about. But, again, it’s not about this particular researcher. Indeed, now the data are out there — I assume that at least the average test scores for each school and grade can be released publicly? —Other people can do their own analyzes. Somebody had to get the ball rolling.
There was a problem with the news article, in that the claims from the research paper were reported completely uncritically, with no other perspectives. Yes, there were qualifiers (“If Gilraine’s result holds up to further scrutiny.. It’s too hasty to draw sweeping conclusions on the basis of one study”) but the entire article was written from the perspective that the claims from this study were well supported by the data analysis, which turns out not to have been the case.
What could the reporter have done? Here’s what I recommendeda couple years ago:
When you see a report of an interesting study, he contact the authors and push them with hard questions: not just “Can you elaborate on the importance of this result?” But also “ How might this result be criticized? ”,“ What’s the shakiest thing you’re claiming? ”,“ Who are the people who won’t be convinced by this paper? ”, Etc. Ask these questions in a polite way, not in any attempt to shoot the study down — your job, after all, is to promote this sort of work — but rather in the spirit of fuller understanding of the study.
I think the biggest problem with that news article was its misleading title, “Installing air filters in classrooms has surprisingly large educational benefits.”
To his credit Yglesias follows up with another caveat and comes up with a reasonable conclusion:
And while it’s too hasty to draw sweeping conclusions on the basis of one study, it would be incredibly cheap to have a few cities experiment with installing air filters in some of their schools to get more data and draw clearer conclusions about exactly how much of a difference this makes.
Perhaps school systems are already experimenting with pollution-control devices; I don’t know. They’re installing heating, ventilation, and air conditioning units all over the place, so I’m guessing this is part of it.
I don’t think the correct summary of the above study is: “A large effect was found. But this was a small study, it’s preliminary data, so let’s gather more information. ”Rather, I think a better summary is:“ The data showed no effect. A particular statistical analysis of these data seemed to show a large effect, but that was a mistake. Perhaps it’s still worth studying the problem because of other things we know about air pollution, in which case this particular study is irrelevant to the discussion. ”
Or, even better:
New study finds no evidence of educational benefits from installing air filters in classrooms
A new study was performed of a set of Los Angeles schools and found no effects on test scores, comparing schools with and without newly-installed air filters.
However, this was a small study, and even though it found null effects, it could still be worth exploring the idea of installing air filters in classrooms, given all that we believe about the bad effects of air pollution.
We should not let this particular null study deter us from continuing to explore this possibility.
The point is that these data, analyzed appropriately, do not show any clear effect. So if it’s a good idea to keep on with this, it’sin spite of, notbecause ofthese results.
And that’s fine. Just cos a small study found a null result, that’s no reason to stop studying a problem. It’s just that, if you’re gonna use that small study as the basis of your news article, you should make it clear that the result was, in fact, null, which is no surprise given high variability etc.
**************************
********************** Read More****


GIPHY App Key not set. Please check settings