

Posted by Brandon Azad, Project Zero
In my role here at Project Zero, I do not use some of the tooling used by some external iOS security researchers, in particular development-fused iPhones with hardware debugging capabilities like JTAG enabled. I believe that access to such devices puts those who can get them at a significant advantage over researchers who can not or do not wish to use them. Thus, early this year I decided I would try to find a way to build such a capability using regular iPhones you can buy at an Apple store. I identified iBoot and KTRR as primary areas for research, and spent several months looking for vulnerabilities.
)
On June (th, I)discoveredthat the A 11 SoC used in the iPhone 8 and iPhone X has the CoreSight External Debug registers enabled. Combined with the capabilities I reversed from a proprietary debugging register called DBGWRAP, this is sufficient to debug the CPU at any time during its operation, including during execution of the reset vector after a core sleeps and before the MMU and KTRR have been re-enabled . By single-stepping execution of the reset vector and modifying register state at key points, it is possible to skip MMU KTRR lockdown and remap protected kernel memory as writable. I used this capability to build a hardware-level single-step kernel debugger for the iPhone X calledKTRWthat can be used with LLDB and IDA Pro and works with an off-the-shelf Lightning cable.
**
This research was conducted before@ axi0mXreleased thecheckm8iOS SecureROM exploit and is independent of it.
The bootstrapping problem
Doing security research on iPhones is hard, and in my opinion, much harder than it needs to be. Apple has done an impressive job locking down their devices, and while such security improvements are certainly welcome, it does mean that security researchers have to invest a lot of time and effort to create a viable research platform.
The need to maintain a research platform can create perverse incentives for well-intentioned security researchers. One common outcome is that researchers will hoard vulnerabilities, only reporting some while keeping the rest for bootstrapping. This is of course less than ideal, since some of these vulnerabilities could simultaneously be used as 0-days to attack users.
Alternatively, many security researchers are able to acquire development-fused iPhones with hardware debugging features (SWD, JTAG) enabled, allowing them to debug the main Application Processor (AP) and some peripherals like the Always On Processor (AOP) and the Secure Enclave Processor (SEP). By halting execution in the bootloader, it is possible to patch the kernel to disable security features before the kernel has even had a chance to run. This makes these devices extremely useful for security research.
More recently, virtualization solutions have gained prominence in the iOS security research community. In principle, virtualization offers a way to conduct security testing on iOS without being subject to the hardware restrictions that prevent kernel modification. The caveat is that these products are often accessed over the web, which would mean that any experiments conducted on a virtualized device could in theory be visible to the company providing the service.
None of these options sit well with me. I do not withhold security bugs, I do not use development-fused devices, and I do not feel it is appropriate for me to run sensitive experiments that could disclose potential iOS security vulnerabilities on third party servers. This puts me at a disadvantage relative to adversaries developing and deploying 0-day capabilities who may be using any or all of these strategies.
Thus, back in March, I decided it would be worthwhile to investigate whether it was possible to create my own homebrewed development iPhone using only certified Apple parts.
KTRR and other hardware mitigations
At the heart of what makes conducting security research on iOS difficult is a hardware mitigation called KTRR, which likely stands for Kernel Text Readonly Region. Siguza@ s1guza) has an excellent article onKTRRwhich I highly recommend reading.
Since Apple does not publish details about their hardware mitigations, it is hard to know the exact boundary of each mitigation. In this post I will try to use the terminology suggested in the public XNU sources, even though this differs from the terms used in some other articles.
In effect, KTRR is a stronger form ofW ^ X protection, enforced over all memory accesses from EL1 and implemented in both thememory management unit(MMU) and in thememory controller. (Apple’s memory controller appears to be referred to as AMCC in the sources.) The MMUs and the AMCC can each be programmed with a physical address range, respectively referred to as the MMU KTRR region and the AMCC KTRR region. Each MMU ensures that writes to physical addresses within the MMU KTRR region and EL1 instruction fetches from addresses outside the region will generate a synchronous exception. Likewise, the AMCC ensures that writes issued to the memory controller for physical addresses inside the AMCC KTRR region will be discarded. In this way, the kernel locks down its executable code (and read-only data) so that it cannot be modified and new executable code cannot be injected.
In order to lock down the MMU, Apple has defined three new system registers:KTRR_LOWER_EL1,KTRR_UPPER_EL1, andKTRR_LOCK_EL1.KTRR_LOWER_EL1andKTRR_UPPER_EL1define the lower and upper bounds of the MMU KTRR region.KTRR_LOCK_EL1is a lockdown register: once the value1has been written to it, all three registers are locked down and can no longer be modified (although they still lose their values on core reset, that is, after a core wakes from sleep).
Once the MMU has been enabled, it enforces that all memory writes to the MMU KTRR region and all instruction fetches at EL1 from outside the region will generate a synchronous exception. This means that regardless of the permission bits specified in the page tables, and regardless of the configuration of any other system registers (including theAPRR registers), it is impossible to have memory that is both writable and executable, and it is impossible to change which memory is executable.
However, implementing KTRR in the MMU alone is not enough to ensure kernel code integrity. For example, DMA attacks and other attacks from peripherals would reach the memory controller without first passing through an MMU on the application processor. Thus, Apple had to bring KTRR to the AMCC as well, with its own readonly region and lockdown registers accessible viamemory-mapped I / O(MMIO).
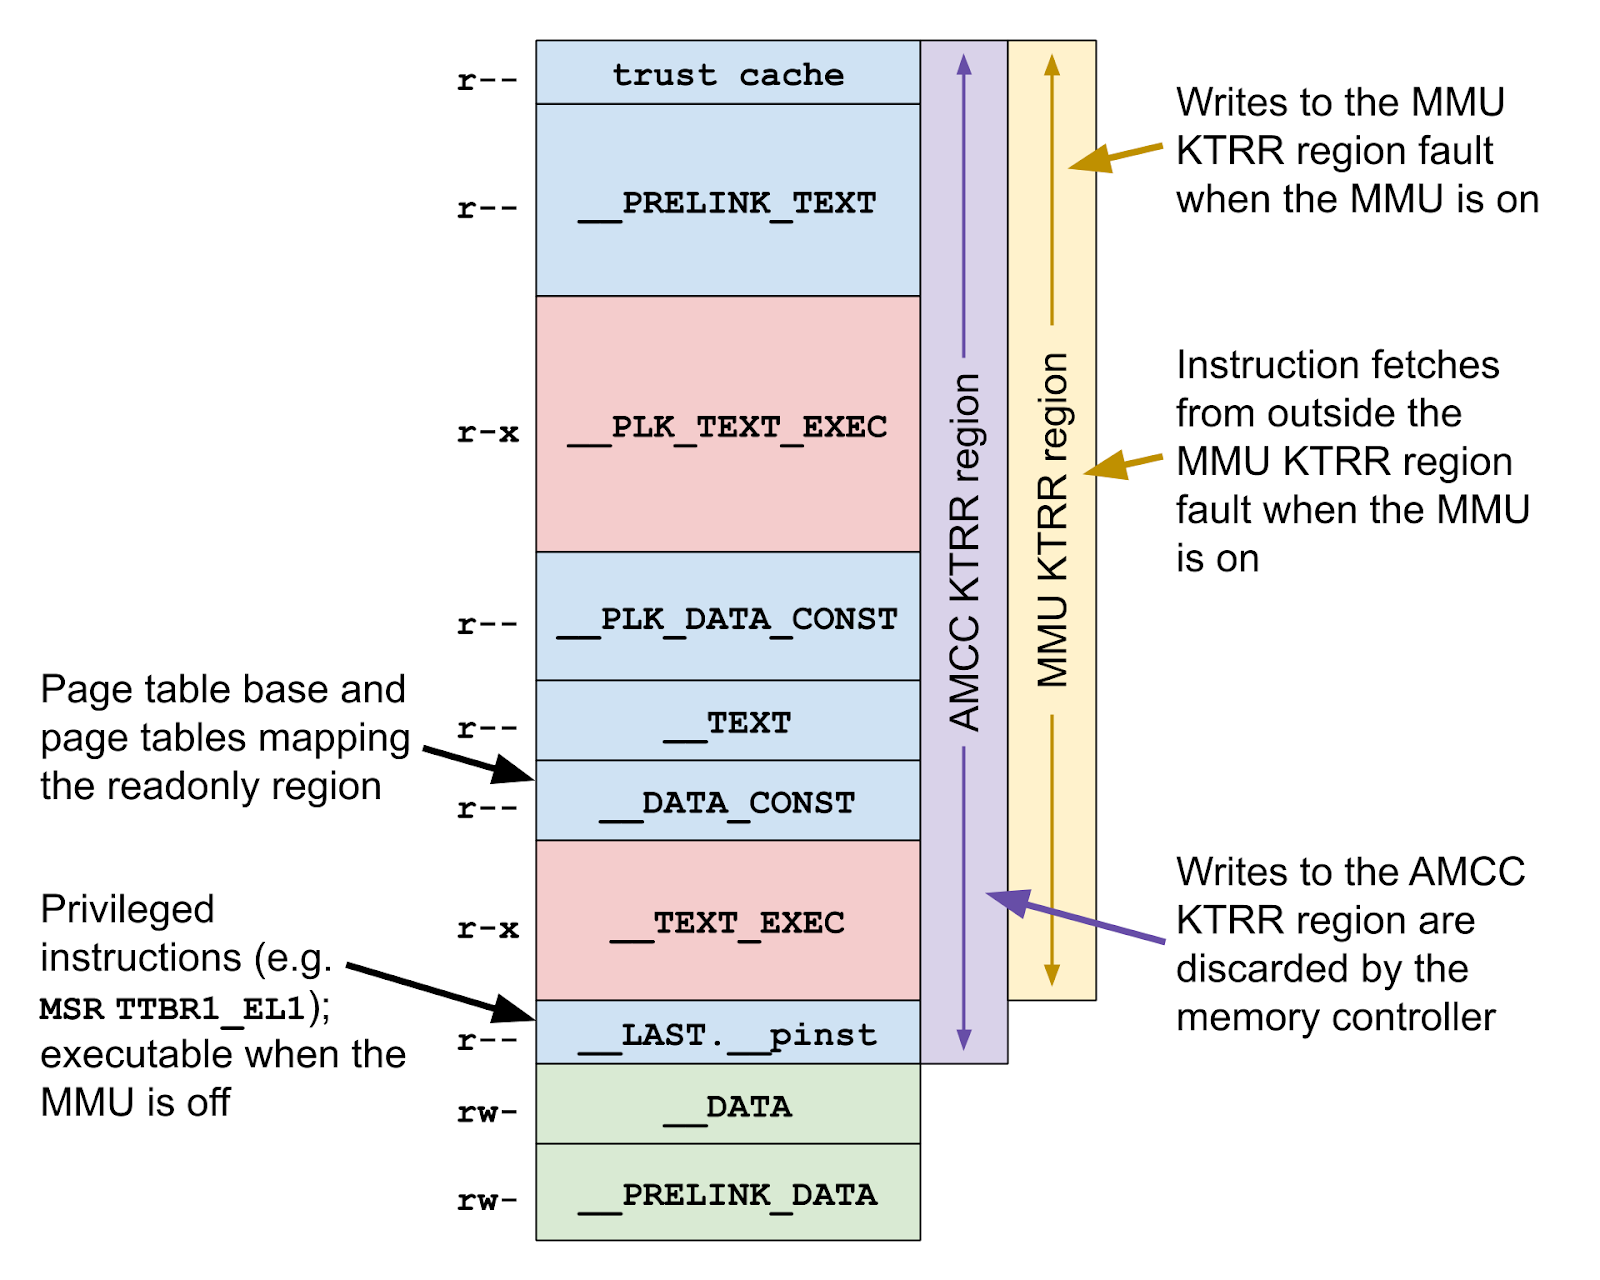
This combination of implementing KTRR in the MMU and the AMCC makes it extremely effective. The MMU and AMCC KTRR regions protect all critical kernel resources, including the page table root and page tables describing the readonly region itself. Instructions which might be used to break KTRR have been moved to a special page,__ LAST .__ pinst, which is outside the MMU KTRR range (making it non-executable) but inside the AMCC KTRR range (making it non-writable). In particular, there are no executable copies of the instructionMSRTTBR1_EL1,X0, which sets a new page table root for address translations for the kernel’s half of the address space, or of the instructionMSRSCTLR_EL1,X0, which could be used to turn off the MMU. (This last part is only true on A 10 and A 11; Apple added a new hardware mitigation on A 12 that bringsSCTLR_EL1back into executable memory .
In order to bypass KTRR and load new executable code, one would need to find a way to prevent the MMU KTRR lockdown from occurring. However, this attack surface is incredibly slim: after a core wakes from sleep, the system will begin by executing the reset vector,LowResetVectorBase, which programs and locks down the MMU KTRR registers within the first 100 Instructions.
The goals for a research iPhone
So, now that we know what we’re up against, what exactly are the features I think would be most useful in a homebrewed research iPhone?
-
The most important feature, but also the hardest to achieve, is that it should be possible to patch KTRR-protected kernel memory, and in particular to patch__ TEXT_EXEC, the segment that contains the kernel’s executable code. If this were possible, it would then become easy to disable other mitigations (like codesigning) that make userspace security research difficult.
-
It should be possible to perform single-step iOS kernel debugging. This would aid in runtime analysis of the kernel and make it easier to demonstrate incorrect behavior in a PoC for a vulnerability.
-
It should not be tied to a specific version of iOS: that is, it should be possible to debug new kernel versions as they come out, either by updating the device normally or by chainloading an updated kernel.
-
It should be usable with existing debugging tools. In particular, I wanted to be able to perform kernel debugging on a live, production-fused iPhone using LLDB and IDA Pro.
-
It should be relatively easy to port to newer versions of iOS.
In fact, this research concept is nothing new. Goal 1 was partially demonstrated back in iOS 10 1.1, and goals 2 and 4 were demonstrated in iOS 11 1.2.
iOS 1.1: The Yalu KTRR bypass
Luca Todesco (@ qwertyoruiopz) demonstrated aKTRR bypassfor iOS 10 1.1 that remapped the kernel’s__ DATA_CONSTsegment, normally protected by KTRR, as writable. His technique relied on two components: one to gain code execution after reset and another to remap KTRR-protected memory.
First, Luca used the fact that writable data was being used in the reset path () LowResetVectorBase, in
OSFMK / ARM 64 /start.s) to gain code execution after every reset. This in and of itself was not a KTRR bypass, since KTRR had already been initialized and the MMU turned on at the point at which he gained code execution. But it was useful for persisting the true bypass so that it would be applied every time a core reset.
Second, an off-by-one error in the MMU KTRR lockdown code inLowResetVectorBaseresulted in the__ LAST .__ pinstpage accidentally being included in the MMU KTRR region, meaning that the instructionMSRTTBR1_EL1,(X0)was left executable even after the MMU was turned on. To take advantage of this, Luca used the first capability to execute a ROP payload after each reset. This ROP payload would bypass KTRR by using that executableMSR
The reason__ TEXT_EXECwas left readonly is that the bypass ran after KTRR was already initialized on the MMU: even though the page tables could be changed, the MMU still prevented any physical pages except the original ones protected by the KTRR AMCC region from being executed. Thus, it remained impossible to patch the kernel’s executable code.
iOS 11 1.2: Build your own iOS kernel debugger
The other precedent for this work came with iOS 11 .1.2, when Ian Beer (@ i 41 nbeer) releasedasync_wake_ios_with_kdp, a single-step kernel debugger that worked with LLDB. You should absolutely read the slides from his MOSEC 2018 talk“Build your own iOS kernel debugger”, which explain in great detail how he accomplished this. I also recommend looking through the source code, which is very well commented.
If you look at theARMv8 Architecture Reference Manual(all quotes are from version Ea, the latest at the time of writing), Chapter D2 describes an interesting feature called “Aarch 64 Self-hosted Debug “:
Self-hosted debug supports debugging through the generation and handling of debug exceptions, that are taken using the exception model described in Chapter D1The AArch 64 System Level Programmers’ Model.
[…]
Within this chapter, debugger means that part of an operating system, or higher level of system software, that handles debug exceptions and programs the Debug System registers.
Essentially, the architecture allows an operating system to program special debug registers in order to act as a debugger, catching exceptions that occur when certain debug-related events are encountered. According to the manual, relevant exception types include:
-
Breakpoint instruction exceptions: Generated when aBRKinstruction is executed.
Breakpoint exceptions: Generated when a hardware breakpoint is hit.
Watchpoint exceptions: Generated when a hardware watchpoint is hit.
Software step exceptions: Generated after a software single-step operation completes.
If the debug registers are configured properly, then these events will be delivered as synchronous exceptions to the exception vector specified in the registerVBAR_EL1.
Under what circumstances will these debug exceptions actually be generated and delivered?
The PE can only generate a particular debug exception when both:
-
Debug exceptions are enabled from the current Exception level and Security state.
SeeEnabling debug exceptions from the current Exception levelon page D2 – 2405. Breakpoint Instruction exceptions are always enabled from the current Exception level and Security state.
-
A debugger has enabled that particular debug exception.
************All of the debug exceptions except for Breakpoint Instruction exceptions have an enable control contained in the MDSCR_EL1. SeeThe debug exception enable controlson page D2 – 2402Reading through the mentioned sections, we find that the following registers are relevant for enabling self-hosted debug:
-
PSTATE: Process State. This is not a real register, but a collection of important processor state information. The relevant flags for debugging are the exception mask bits:
-
D: Debug exception mask. When set, debug exceptions are suppressed. This field resets to1when an exception is taken.
-
(A),(I),F): Asynchronous exception mask bits. These bits mask SError, IRQ, and FIQ interrupts, respectively.
-
MDSCR_EL1: Monitor Debug System Control Register. This register holds the main debug configuration options.
-
MDE: Monitor Debug Enable. Controls whether breakpoint and watchpoint exceptions are enabled.
-
(KDE) *********: Kernel Debug Enable. Enables the kernel running at EL1 to catch its own debug exceptions.
-
DBGBCR
_ EL1 : Debug Breakpoint Control Registern,n=0 – 15. These 16 registers control the behavior of the hardware breakpoints. -
(DBGBVR) ***************************************** (EL1): Debug Breakpoint Value Registern,n=0 – 15. These registers contain information to match the virtual address at which the corresponding breakpoint should trigger.
-
(DBGWCR) ***************************************** (EL1): Debug Watchpoint Control Registern,n=0 – 15. These registers control the behavior of the hardware watchpoints.
-
(DBGWVR) ***************************************** (_ EL1): Debug Watchpoint Value Registern,n=0 – 15. These registers contain information to match the virtual address at which the corresponding watchpoint should trigger.
Basically, Ian’s debugger worked by finding the appropriate system calls, Mach traps, and gadget sequences to set these registers to the necessary values, thus enabling hardware breakpoints and allowing EL1 (kernel mode) to generate debug exceptions.
The final piece is catching those debug exceptions. Being able to trigger a kernel breakpoint exception is not of much use if we cannot somehow catch that exception, dump registers and memory, and then resume normal execution.
What Ian found is that the exception handling functionsleh_synchronous ()(inosfmk / arm) / sleh.c) actually enters a deliberate infinite loop when it catches a breakpoint exception from the kernel:
void
sleh_synchronous(arm_context_t* context,(uint) _ tesr,vm_offset_tfar)
{
esr_exception_class_tclass=ESR_EC(esr);
arm_saved_state_t* state=& context->ss;
…
switch(class) {
…
caseESR_EC_BKPT_REG_MATCH_EL1:
if(FSC_DEBUG_FAULT==ISS_SSDE_FSC) (esr)) {
kprintf(“Hardware Breakpoint Debug exception from kernel. Hanging here (by design). n “);
for(;;);
__unreachable_ok_push
DebuggerCall(EXC_BREAKPOINT, & context->ss);
break;
__unreachable_ok_pop
}
panic(“Unsupported Class% u event code. State=% p class=% u esr=% u far=% p “,
class, state, class, esr, (voidfar);
assert()0);/ * Unreachable * /
break;
…
}
…
}
At the point at which the thread that generated the breakpoint exception enters that infinite loop, its register state at the time of the exception will have been spilled to memory, making it possible to inspect and modify the register values. And finally, Ian was able to restart execution of the debugged thread by waiting for it to be preempted while spinning in that loop and then modifying the spilled state so that the thread resumes execution at the desired location.
Ian’s async_wake kernel debugger was able to achieve two of the goals mentioned above: the debugger supported single-stepping and it worked with LLDB. This was certainly enough to make a useful research platform. However, Apple mitigated the gadgets Ian used, meaning that I couldn’t use his technique on more recent iOS versions. Ideally I wanted something that met all five goals: kernel patching, single-step debugging, support for any iOS version, compatibility with LLDB, and easy maintenance across iOS versions. For that, I turned to iBoot.
Researching iBoot
My initial goal was to find a vulnerability in iBoot that would allow me to boot a patched kernelcache. iBoot is Apple’s second-stage bootloader on the iPhone: it runs after the SecureROM and is responsible for loading the kernelcache, verifying its signature, and jumping to it. With code execution in iBoot, it is possible to boot a kernelcache that is patched to disable KTRR and enable debugging features.
There are two reasons why iBoot was a particularly attractive research target.
First, an iBoot bug easily checks the updateability box. With an iBoot bug, you could theoretically boot any kernelcache you want, allowing you to “upgrade” or “downgrade” the iOS version arbitrarily. Even after the bug is fixed, iPhones with a vulnerable iBoot version should still be able to boot the latest version of iOS with a patched kernel.
Second, an iBoot bug could make it possible to load a patched kernelcache even when no kernel vulnerabilities are known. Currently, in order to develop an iOS kernel research platform, you need to already have a kernel vulnerability. Unless you withhold bugs, this makes it difficult to analyze the latest kernel version in which all known vulnerabilities have been fixed. However, if iBoot is your entry point, then you do not need any kernel vulnerabilities to conduct research.
Ultimately, I did not end up finding any vulnerabilities in iBoot. That said, I believe such bugs exist, and it could be an interesting area for future research.
All paths lead to debug registers
Eventually, a number of things drew me away from iBoot and back to KTRR, and in particular to revisit the concept of debug registers:
-
I had read somewhere (the exact source is lost to history) that the debug registers Ian used in his iOS 11 1.2 kernel debugger () DBGBCR
_EL1
, etc.) were also accessible via a memory-mapped interface. If true, this would mean that using these registers for single-step kernel debugging would probably be possible even after Apple mitigated the specific gadgets he used to initialize them.
Looking through theARMv8 Architecture Reference Manual‘s table of contents, I noticed that self-hosted debug (Chapter D2) is just one place where debugging is mentioned. In fact there is a whole section (Part H, Chapters H1 – H9) that is devoted to another debugging interface called External Debug.
(InLowResetVectorBase, XNU’s reset vector, this is the very first instruction:
**
// Unlock the core for debugging
msr OSLAR_EL1, xzr(At)MOSEC 2019, Zhenyu Ning and Fengwei Zhang presented an interesting attack on Android platforms calledNailgun. The Nailgun attack abuses debug registers enabled on certain Android devices to break privilege barriers, for example byextracting fingerprint imagesstored in TrustZone protected memory.
Thus, debug registers were really on my mind when I finally decided to pay attention to what an odd panic message I had occasionally encountered in my experiments was telling me.
If you have ever played around on an iPhone and managed to get a core stuck in an infinite loop with interrupts disabled, you may have received a panic message that goes something like this:
“panicString”: “Attempting to forcibly halt cpu 1 ncpu 1 failed to halt with error -5: halt not supported for this configuration nDebugger synchronization timed out; waited 10000000 nanoseconds npanic (cpu 0 caller 0xfffffff 00 B5C 96 bc): “WDT timeout: CPU 1 failed to respond ” @ / BuildRoot / …
This message says that the application processor’s watchdog timer (WDT) timed out while waiting on CPU (core) 1. This happens when a core fails to check in with theAppleARMWatchDogTimerkext for several seconds .
But what caught my attention was the first part of the panic string: “Attempting to forcibly halt cpu 1”. Forcibly halting a CPU while it is running really sounds like some sort of CPU control register might be involved. And with an error string to grep for, I had a starting place.
Searching for this string in the XNU sources, I found that the functionDebuggerXCallEnter ()(file)OSFMK /arm/model_dep.c) contained the following interesting snippet:
for(cpu=0; cpu
…
if(proceed_on_sync_failure) {
paniclog_append_noflush(“Attempting to forcibly halt cpu% d n”, CPU);
dbgwrap_status_thalt_status=ml_dbgwrap_halt_cpu(cpu,0
);if(halt_status0))
paniclog_append_noflush(“cpu% d failed to halt with error% d:% s n “, cpu, halt_status,ml_dbgwrap_strerror(halt_status));
…
}
…
}
A comment aboveDebuggerXCallEnter ()states that this function is responsible for interrupting other cores on the AP “so this core can run in a single-threaded context”. This is what we are seeing in this for loop: the functionml_dbgwrap_halt_cpu ()seems to be the one that actually does the work to halt a specific core. And looking at the fileosfmk / kern / debug.c, we can see thatDebuggerXCallEnter ()is indeed being called as part of the panic path.
So, how doesml_dbgwrap_halt_cpu ()actually halt a running CPU core? The implementation is in the fileOSFMK / ARM 64 / dbgwrap.c, which is just filled with interesting information.
Here is the implementation ofml_dbgwrap_halt_cpu ():
dbgwrap_status_t
ml_dbgwrap_halt_cpu(intcpu_index,Uint 64 _ ttimeout_ns)
{
cpu_data_t* cdp=cpu_datap(cpu_index);
if((cdp==)NULL) || (cdp->coresight_base [CORESIGHT_UTT]==0))
return DBGWRAP_ERR_UNSUPPORTED;
…
volatiledbgwrap_reg_t* dbgWrapReg=(volatiledbgwrap_reg_t
(cdp->coresight_base [CORESIGHT_UTT] DBGWRAP_REG_OFFSET);
if(ml_dbgwrap_cpu_is_halted(cpu_index))
returnDBGWRAP_WARN_ALREADY_HALTED;
/ * Clear all other writable bits besides dbgHalt; none of the
* power-down or reset bits must be set. * /
* dbgWrapReg=DBGWRAP_DBGHALT;
…
else
returnDBGWRAP_SUCCESS;
}
This tells us a lot of tantalizing information! Thecpu_datap ()function retrieves a pointer to the current core’scpu_datastruct, so whatever thecoresight_basearray is, there is one for each AP core. Then, we see an assignment of some value derived from that array to a volatile variable calleddbgWrapReg; the name and the fact that it is declared volatile strongly suggest thatdbgWrapRegis a pointer to some sort of MMIO, and reading and writing it will directly read and write a core-specific register. And the comment below suggests that theDBGWRAPregister contains bits involved in halting, powering down, and resetting the core.
But the real gem is a bit further down. Keep scrolling pastml_dbgwrap_halt_cpu ()and you will find a fascinating function calledml_dbgwrap_halt_cpu_with_state ()):
dbgwrap_status_t
ml_dbgwrap_halt_cpu_with_state
intcpu_index,Uint 64 _ ttimeout_ns,
dbgwrap_thread_state_t* state)
{
cpu_data_t* cdp=cpu_datap(cpu_index);
if((cdp==)NULL) || (cdp->coresight_base [CORESIGHT_ED]==0))
returnDBGWRAP_ERR_UNSUPPORTED;
/ * Ensure memory-mapped coresight registers can be written * /
* ((volatileuint 32 _t(cdp->coresight_base [CORESIGHT_ED]
ARM_DEBUG_OFFSET_DBGLAR))=ARM_DBG_LOCK_ACCESS_KEY;
dbgwrap_status_tstatus=ml_dbgwrap_halt_cpu(cpu_index, timeout_ns);
/ * A core that is not fully powered ( eg idling in wfi) can still be
* halted; the dbgwrap register and certain coresight registers such
* EDPRSR are in the always-on domain. However, EDSCR / EDITR are not in
* the always-on domain and will generate a parity abort on read.
* EDPRSR can be safely read in all cases, and the OS lock defaults to
* being set but we clear it first thing, so use that to detect the
* offline state. * /
if[…] (volatileuint (_T)(cdp->coresight_base [CORESIGHT_ED]
EDPRSR_REG_OFFSET)) & EDPRSR_OSLK) {
bzero(state,sizeofstate));
returnDBGWRAP_WARN_CPU_OFFLINE;
}
uint 32 _ tinstr;
for(unsigned)inti=0;
isizeof(state->x) /sizeof(state->x [0])); i) {
instr=(0xD (U)20) (2) | (316)
| (48) i;// msr DBGDTR0, x
ml_dbgwrap_stuff_instr(cdp, instr, timeout_ns, & status);
state->x [i]=ml_dbgwrap_read_dtr(cdp, timeout_ns, & status);
}
instr=(0xD (U)20) (2) | (316)
| (48)29;// msr DBGDTR0, fp
ml_dbgwrap_stuff_instr(cdp, instr, timeout_ns, & status);
state->fp=ml_dbgwrap_read_dtr(cdp, timeout_ns, & status);
instr=(0xD (U)20) (2) | (316)
| (48)30;// msr DBGDTR0, lr
ml_dbgwrap_stuff_instr(cdp, instr, timeout_ns, & status);
state->lr=ml_dbgwrap_read_dtr(cdp, timeout_ns, & status);
/ * Stack pointer (x 31) can’t be used as a register operand for msr;
* register 31 is treated as xzr rather than sp when used as the
* transfer operand there. Instead, load sp into a GPR we’ve already
* saved off and then store that register in the DTR. I’ve chosen x 18
* as the temporary GPR since it’s reserved by the arm 64 ABI and unused
* by xnu, so overwriting it poses the least risk of causing trouble
* for external debuggers. * /
instr=(0x (U)
*************************************************************************************************************
)315)18;// mov x 18, sp
ml_dbgwrap_stuff_instr(cdp, instr, timeout_ns, & status);
instr=(0xD (U)20) (2) | (316)
| (48)18;// msr DBGDTR0, x 18
ml_dbgwrap_stuff_instr(cdp, instr, timeout_ns, & status);
state->sp=ml_dbgwrap_read_dtr(cdp, timeout_ns, & status);
/ * reading PC (eg through adr) is undefined in debug state. Instead
* use DLR_EL0, which contains PC at time of entry into debug state. * /
instr=(0xD 53 U20) | (1) | (316) (412)
| (58) (15)18;// mrs x 18, DLR_EL0
ml_dbgwrap_stuff_instr(cdp, instr, timeout_ns, & status);
instr=(0xD (U)20) (2) | (316)
| (48)18;// msr DBGDTR0, x 18
ml_dbgwrap_stuff_instr(cdp, instr, timeout_ns, & status);
state->pc=ml_dbgwrap_read_dtr(cdp, timeout_ns, & status);
/ * reading CPSR is undefined in debug state. Instead use DSPSR_EL0,
* which contains CPSR at time of entry into debug state. * /
instr=(0xD 53 U20) | (1) | (316) (412)
| (58)18;// mrs x 18, DSPSR_EL0
ml_dbgwrap_stuff_instr(cdp, instr, timeout_ns, & status);
instr=(0xD (U)20) (2) | (316)
| (48)18;// msr DBGDTR0, x 18
ml_dbgwrap_stuff_instr(cdp, instr, timeout_ns, & status);
state->cpsr=(uint 32 _ t)ml_dbgwrap_read_dtr(cdp, timeout_ns, & status);
returnstatus;
}
Whatml_dbgwrap_halt_cpu_with_state ()appears to do is halt the specified CPU core and then retrieve its register state. That in and of itself is not remarkable. What is remarkable is the way it does this.
In order to retrieve the values of registers on the halted CPU core, this function actuallyforces the halted CPU to execute instructionsthat write the general-purpose register values to a special debug register calledDBGDTR0. And these instructions aregenerated programmatically on the fly), not preexisting instructions protected by KTRR.
What this means is that, at least in theory, it might be possible to make a CPU core execute a KTRR-sensitive instruction likeMSRTTBR1_EL1,X0even if there are no copies of that instruction in KTRR-protected memory.
Digging deeper
My next step was to figure out what these debug registers were, and if they were actually enabled.
A bit of research revealed that some of the registers mentioned indbgwrap.cwere related to an ARMv8 feature called External Debug and the debug architecture into which it is embedded called CoreSight. Let’s start with the latter.
The external debug interface is much simpler to describe, and is documented in Part H of the ARMv8 Architecture Reference Manual. Just like self-hosted debug provides debug exceptions which cause the core to execute debugger code in the exception vector, external debug provides debug events which cause the core to enter debug state.
These are a few of the debug events mentioned in the manual:
-
Exception catch debug event: An external debugger can program a core to generate an exception catch debug event every time the core enters a particular exception level.
-
Reset catch debug event: This event can be generated every time the core resets and is about to execute the reset vector.
-
Breakpoint debug event: This event can be generated when a core hits a hardware breakpoint.
-
Watchpoint debug event: This event can be generated when a core hits a hardware watchpoint.
-
Halting step debug event: This event can be generated after a core completes executing an instruction as part of a single-step operation.
Once a debug event occurs, the core will halt and enter debug state, from where it can be manipulated by an external debugger. From the manual:
In external debug, debug events allow an external debugger to halt the PE. The PE then enters Debug state. When the PE is in Debug state:
-
It stops executing instructions from the location indicated by the program counter, and is instead controlled through the external debug interface.
-
(TheInstruction Transfer Register, ITR, passes instructions to the PE to execute in Debug state.
-
(TheDebug Communications Channel, DCC, passes data between the PE and the debugger.
-
Wait for the core to halt. Once it has halted, it is about to execute the first instruction ofLowResetVectorBase. The KTRR registers will not yet be initialized.
-
Using the external debug registers andDBGWRAP, repeatedly single-step execution of the core. On each step, read the PC value on the debugged core to determine the instruction about to be executed.
-
Once the core is about to execute the KTRR initialization instructions, use the external debug registers to overwrite values in the debugged core’s general purpose registers such that it skips KTRR initialization.
-
(Use
The PE cannot service any interrupts in Debug state.The Instruction Transfer Register (ITR) and Debug Communications Channel (DCC) are respectively responsible for making the halted core execute instructions and transferring data from the halted core toml_dbgwrap_halt_cpu_with_state (). In order to read a register from the halted core, the functionml_dbgwrap_stuff_instr ()uses the memory-mapped ITR to supply the halted core with an instruction that moves the desired register value into the system registerDBGDTR_EL0. From there, the value ofDBGDTR_EL0is read by the functionml_dbgwrap_read_dtr ()using the memory-mapped DCC registersDBGDTRRX_EL0andDBGDTRTX_EL0.
Finding the registers
The XNU code seems to suggest that the external debug registers exist, but how do we find them?
Tracing through the XNU source, we find the functionconfigure_coresight_registers ()inOSFMK / ARM 64 / cpu.c:
staticvoid
configure_coresight_registers(cpu_data_t* cdp)
{
…
/ *
* ARMv8 coresight registers are optional. If the device tree did not
* provide cpu_regmap_paddr, assume that coresight registers are not
* supported.
* /
if(cdp->cpu_regmap_paddr) {
for(i=0; i
/ * Skip CTI; these registers are debug-only (they are
* not present on production hardware), and there is
* at least one known Cyclone errata involving CTI
* (rdar: // 12802966). We have no known clients that
* need the kernel to unlock CTI, so it is safer
* to avoid doing the access.
* /
if(i==CORESIGHT_CTI)
continue;
/ * Skip debug-only registers on production chips * /
if(((i==CORESIGHT_ED) || (i==CORESIGHT_UTT))
&&! Coresight_debug_enabled)
continue;
if(! cdp->coresight_base [i]) {
addr=cdp->cpu_regmap_paddr CORESIGHT_OFFSET(i);
cdp->coresight_base [i]=(vm_offset_t)
ml_io_map(addr, CORESIGHT_SIZE);
…
}
…
}
}
}
This suggests that the CoreSight registers (external debug, cross-trigger interconnect (CTI), and something called UTT) are mapped at offsets from a fixed base address supplied in the iOS device tree.
Thedevice treeis passed to XNU by iBoot and specifies parameters of the system’s hardware, including the physical addresses of any special hardware registers used to interact with devices. In this case, by comparing the device tree with the value ofcpu_regmap_paddrread at runtime, I learned that the base address of the CoreSight registers for CPU corencan be found in the device tree propertycpus / cpu
/ reg-private . On my iPhone 8, these addresses are0x 208for coren. Thus, assuming they are enabled, all one would need to do in order to access the external debug registers is map physical address0x 208
(or whatever thereg-privateaddress is in the device tree) and then read and write to the offsets (available in the manual) corresponding to the registers. Testing the debug registers
So, the registers used byml_dbgwrap_halt_cpu_with_state ()are documented in the ARMv8 manual, and we know the base address at which they are mapped, but that does not necessarily mean that these features are implemented and accessible on production hardware. In order to find out, I needed to test whether the debug authentication signals were on and whether the debug registers actually worked.
According to the manual, there should be an implementation-defined authentication interface for the external debug features. When the authentication signals are off, then the corresponding debug features are disabled; when the signals are on, the debug features are available.
To check which debug authentication signals are enabled, I read the value of the external debug registerDBGAUTHSTATUS_EL1at offset0xfb8. The architecture provides four signals: SNID (Secure Non-Invasive Debug), SID (Secure Invasive Debug), NSNID (Non-Secure Non-Invasive Debug), and NSID (Non-Secure Invasive Debug). The debugging features we need to bypass KTRR rely on NSNID and NSID being enabled. Surprisingly, reading theDBGAUTHSTATUS_EL1register via MMIO produced0xf, suggesting that both signals were in fact enabled.
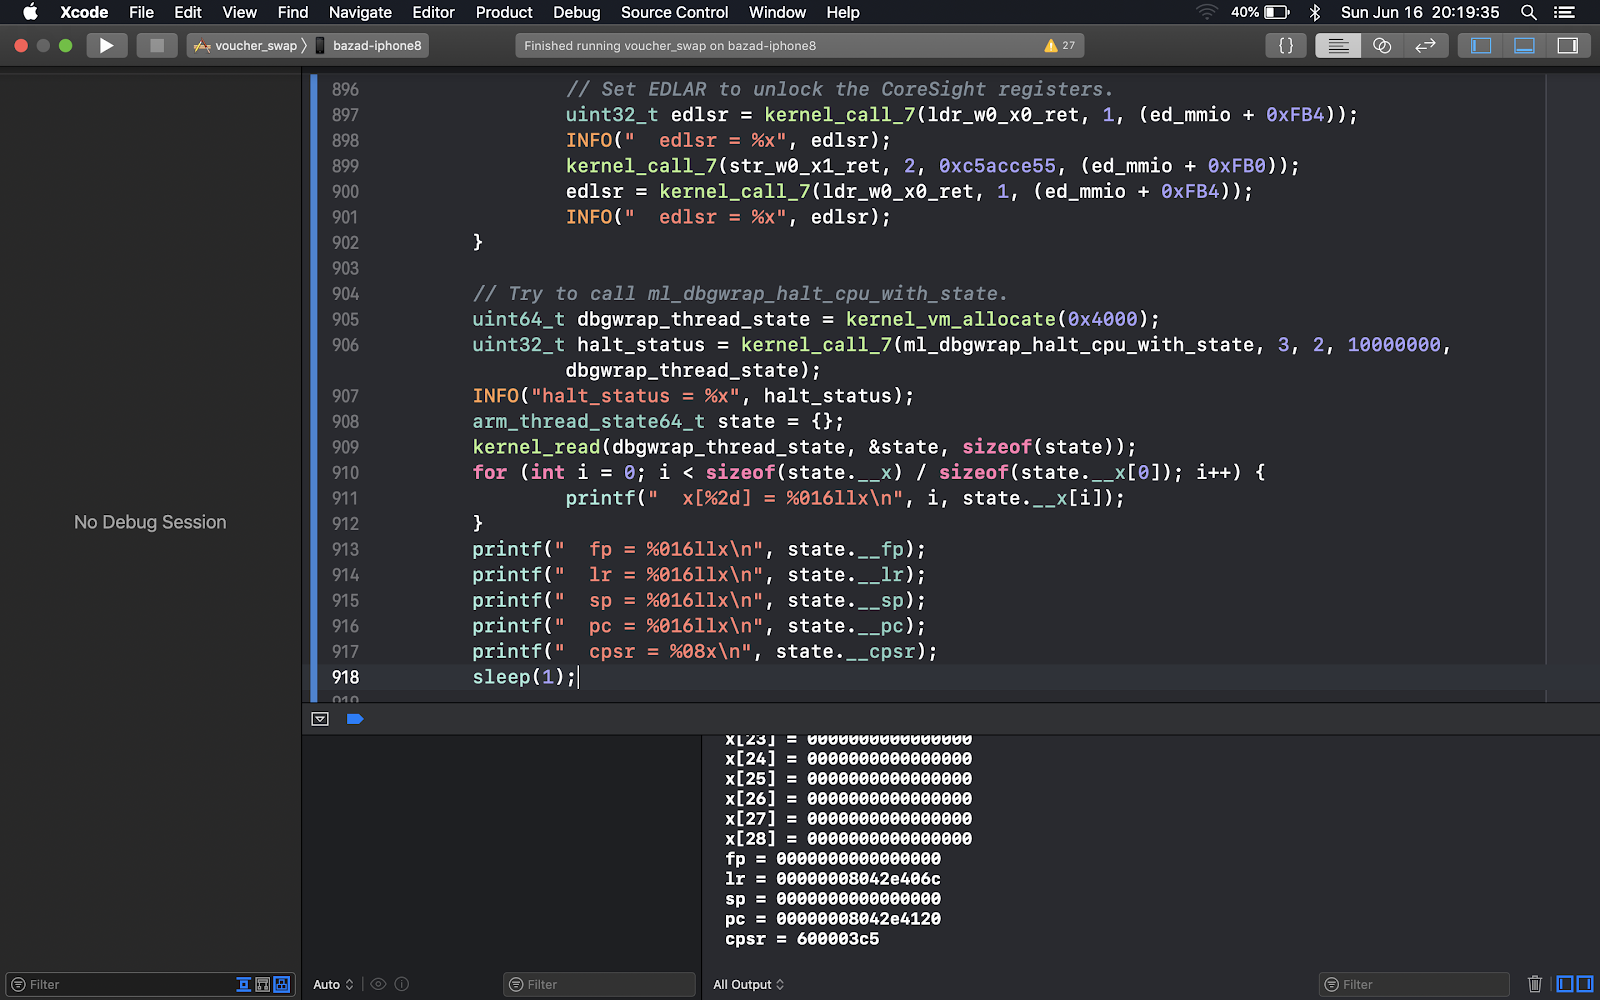
So the next step was to test whetherml_dbgwrap_halt_cpu_with_state ()could actually halt a core and execute instructions on it to read that core’s register state. After modifyingvoucher_swapto map the CoreSight registers manually and then callml_dbgwrap_halt_cpu_with_state (), I saw the following output:

In the output window, the register values read byml_dbgwrap_halt_cpu_with_state ()look valid. Thus, it is entirely possible to execute dynamically-generated instructions on a halted CPU core on production A (iPhones!)
But what is even more remarkable from the above screenshot is that it appears that the core was halted while it was executing code from the reset vector with the MMU off! The value of CPSR shows that the core is executing in kernel mode with interrupts disabled, and yet the PC value0x (e)is not a normal kernel address. In fact, it is the physical address corresponding to the unslid kernel virtual address0xfffffff 0070 e 4120, which is near the end ofLowResetVectorBase(specifically, at the instruction that loads the address ofconst_boot_argsintoX 20before verifying the reset handler).
The reason this is remarkable is that it opens up another possible technique to bypass KTRR: given that we can halt a core and execute instructions on it before the MMU has been turned on, is it perhaps possible to use these debug registers to modify execution of the reset vector itself to prevent KTRR from ever being enabled on the MMU?
More debugging features needed
Actually, even though we have proved that it is possible to execute instructions on a debugged core while the MMU is off, this alone is not necessarily enough to bypass KTRR. For example, even though we can useDBGWRAP) to halt a core, the ARMv8 external debug interface contains no mechanism to get a core out of debug state and resume normal execution (which is called restarting). Thus, I needed to find some other feature that would make these debugging registers useful.
The first thing I looked at was finding a useful instruction to execute on the debugged core. Even though the core will execute instructions written to the ITR, not all instructions are available in debug state. The ARMv8 manual specifies a list of instructions that are available, most of which are related to moving values between registers, accessing system registers, and loading and storing from memory. But even fewer are actually available on the A 11: for some reason, load and store instructions fail to execute in debug
Even so, most instructions that read and write system registers (MSRand(MRS)instructions) do work in debug state. Thus, another idea I investigated was whether there exists a system register shared between cores such that writing to it would change global state in some way that facilitates a KTRR bypass. However, without better knowledge of Apple’s proprietary system registers, I was unable to find anything that worked.
Finally, I decided to turn back to theDBGWRAPregister mentioned indbgwrap.c. The comment inml_dbgwrap_halt_cpu ()suggests that the register contains many different bits to control the behavior of a core, and yet only 2 bits (DBGHALTto halt a core andDBGACKto check if the core is halted) are defined in the file. Thus, I suspected that there might be other bits of interest and performed experiments to figure out what they might be.
As it turns out,DBGWRAPactually contains at least 3 other, undocumented bits, all of which are extremely useful. Setting bit 29 will cause the core to enter debug state the next time it resets and is about to execute the reset vector. Setting bit 30 will cause the core to restart, exiting debug state and resuming normal execution. And setting bit 26 seems to prevent the core from resetting so long as the phone is plugged in and active (ie not sleeping).
With that, we now have everything necessary to bypass KTRR.
Bypassing KTRR
This is the method I chose to disable KTRR on the MMU (repeated for each core):
UsingDBGWRAP, configure the core to enter debug state next time it resets.
DBGWRAPto restart the core, exiting out of debug state. KTRR will be disabled on the MMU, meaning that it is now possible to execute memory outside the KTRR readonly region.
With that, it is possible to setTTBR1_EL1to a custom page table base and remap the kernel onto fresh, writable physical pages outside of the AMCC KTRR range.
KTRW
In order to make this functionality useful, I packaged the KTRR bypass in an iOS kext loader and kernel debugger named KTRW. KTRW makes it possible to compile a C program into a Mach-O file and then dynamically load and link the binary against the running kernel. The iOS kernel debugger implements a GDB stub accessible over USB.
Of course, KTRW (and in particular the GDB stub kext) is significantly more complicated than just the KTRR bypass itself, and I encountered numerous interesting challenges that needed to be overcome (including writing a USB stack from scratch for undocumented hardware). However, theKTRW source codeshould be reasonably well commented, so I refer interested readers there.
This particular KTRR bypass only works on A 11 devices; the debugging registers do not appear accessible on A 12 devices, and they appear only partially functional on A9 (0x 202010000) and A 10 (0x 202210000, which differs from the device tree). It is difficult to know for sure whether the debugging registers are truly unusable on these other devices without greater insight into the hardware; they might work perfectly under some slight variation of the setup I’m using or if they are first configured using some proprietary mechanism.
Is this a security vulnerability?
While this was reported to Apple as Project Zeroissue 1900, neither Project Zero nor Apple considers the existence of these debug registers a security vulnerability.
The reason is that in order to use these registers to bypass KTRR, one would already need to have a kernel arbitrary read / write capability, at which point the device should be considered fully compromised anyway. Once an attacker has kernel read / write, they have access to any data used by any app on the system.
For evidence that kernel read / write is all an attacker needs in practice, I highly recommend reading Ian’s phenomenal technical analysis offive in-the-wild iOS exploit chains, including hisanalysis of the implant itself. He found that the attackers only used the kernel read / write capability to launch the implant binary; after the implant has launched, it gets access to all the data it exfiltrates using normal userspace APIs.
On research phones and SecureROM exploits
Apple announced at BlackHat 2019 that they are considering providing “research-fused” devices to security researchers. I genuinely hope that they deliver on that promise soon (without requiring NDAs or other restrictions placed on security researchers like myself), as I personally believe that would be a tremendous step forward for open security research.
The presence of the debug registers allow one to bypass KTRR and debug the kernel even in the absence of a SecureROM vulnerability. In practice, however, the publication of the SecureROM exploit solves most of the goals I listed for a research iPhone, and provides the added benefit of not needing a kernel vulnerability to do so. I expect future A 11 research platforms to be based around that capability.
Conclusion
One of the things I hoped to convey in this post is that the path to discovering this KTRR bypass was surprisingly straightforward. Considering Ian’s prior work looking at self-hosted debug, the extensive ARM documentation on external debug, the public research on the Nailgun attack on Android, and the XNU sources practically spelling out how to execute dynamically generated instructions, I’m confident that I ‘ m not the first one to discover this issue.
My general fear is that the secrecy surrounding knowledge and techniques in the iOS security research community is allowing the privately held state-of-the-art of security research to diverge from the publicly shared state-of-the-art. If this happens, it puts defenders at a systemic disadvantage.
I suspect that KTRR bypasses (and this bypass in particular) are one example of this divergence. Having spoken with several members of the iOS research community, I believe knowledge of these debug registers was widespread in certain circles. For example, Xerub (@ xerub) presented a slide at MOSEC 2018 that hinted at the surprising capabilities offered by debugging features. And Siguza hinted at a KTRR bypass in hisblog post on APRR.
Furthermore, I suspect that other KTRR bypass techniques have been privately discovered. This technique is not the only way to bypass KTRR, and there are almost certainly techniques that still work on the A 12. And yet, researchers rarely if ever publicly admit that they have these capabilities. All of which makes me wonder: what other techniques and capabilities are known only in private circles?
)In making KTRW public, I want to facilitate security researchers like myself interested in understanding how the iPhone works and improving its security, and hopefully narrow the gap between publicly shared and privately held capabilities in the process. Those who acquire development-fused devices have access to troves of information that other researchers (who choose not to use such devices) do not have. Adversaries looking to harm iPhone users already have these capabilities. Hopefully, with more eyes on iOS internals, we can continue to improve its security in the long run.

(Read More) -


GIPHY App Key not set. Please check settings