

![]()
Original Link: https://www.anandtech.com/show/15044 / the-amd-ryzen-threadripper – 3960 x-and – (x-review -) – and – 32 – cores-on-7nm
One of the constant themes of 2019 has been to ask AMD employees about the future of its Threadripper line of products. Since the start of the year we’ve seen AMD advertise for a new head of workstation products, we’ve seen AMD accidentally use an old roadmap slide which didn’t have Threadripper listed (leading to speculation it was canceled), and during August I was promised that we would hear more this year. Today that time has come, with AMD launching its 3rdGeneration Threadripper platform for the high-end desktop market. With two processors and 12 motherboards available, AMD is going above and beyond the previous definition of high-end Desktop.
Threadripper: Redefining HEDT Yet Again
AMD’s march on the high-end desktop market since the launch of the first generation of Ryzen has been somewhat brutal. In a market where we were barely moving up by an average of less than 2 cores a generation, in the last three years AMD has slapped 8-cores in the mainstream and 16 for HEDT, swiftly followed up by 32 in HEDT then moving mainstream up to 16, all while the competition rushed to get something up to 18 cores available. The first generations of products, on the Zen and Zen microarchitecture, were about AMD being aggressive in pricing and core counts in order to provide high parallel throughput machines. With the launch of Zen 2 for the Threadripper series today, AMD is now going after raw throughput, and combining that with almost double the number of cores that Intel can offer.
When Threadripper as a brand came to market, AMD promoted it as a product that could tackle any high-parallel throughput tasks. Thread Ripper was a clever play on words: anything that had plenty of threads, the hardware was designed to ‘rip’ through the workload. The only downsides to this hardware was the lack of true AVX2 support (a key addition for some of these workloads), that the per-MHz performance was still a little behind, and that the way the hardware was arranged led to memory access variances that didn’t work great in all scenarios. With the third generation Threadripper being launched today, all of those issues go away: we get AVX2, we get better per-MHz performance, and a more unified memory solution. That’s on top of PCIe 4.0 support, more PCIe lanes, and faster DRAM. On paper alone, one has to ask what the flaws are.
Today’s launch covers two products: the 24 – core TR 3960 X and the 32 – core TR 3970 X. Both of these processors are built from four Zen 2 chiplets paired with a single I / O die, with each chiplet having 6 cores or 8 cores respectively. Both CPUs support 64 PCIe 4.0 lanes, four DDR4 – 3200 memory channels, and are built on a new sTRX4 socket with a new all-AMD TRX 40 Chipset.


AMD Threadripper (X and AMD Threadripper) ********************************************************************************************************************************************************************************************************************************** (X)
AMD has alsolifted the lid on an upcoming 64 – core variant, called the TR 3990 X. We’re covering that news in a separate post, but in a nutshell AMD is bringing its high-frequency variant of the (W EPYC 7H) to the mass market in 2020, with potential room for a 48 – core version as well. Just don’t ask how much that one will cost: the ‘slow’ 225 W version of the 7H 12 has an MSRP of $ 6950, so the Threadripper version is going to be at least 2x the 32 – core $ 1999 Price.
| AMD HEDT SKUs | |||||||
| AnandTech | Cores / Threads |
Base / Turbo |
L3 | DRAM 1DPC |
PCIe | TDP | SRP |
| Third Generation Threadripper | |||||||
| TR (X) | 32 / 64 | 3.7 / 4.5 | (MB) | 4x 3200 | 64 | 280 W | $ 1999 |
| TR 3960 X | 24 / 48 | 3.8 / 4.5 | (MB) | 4x 3200 | 64 | 280 W | $ 1399 |
| Second Generation Threadripper | |||||||
| TR (WX) | 32 / 64 | 3.0 / 4.2 | (MB) | 4x 2933 | 64 | 250 W | $ 1799 |
| TR (WX) | 24 / 48 | 3.0 / 4.2 | (MB) | 4x 2933 | 64 | 250 W | $ 1299 |
| TR (X) | 16 / 32 | 3.5 / 4.4 | (MB) | 4x 2933 | 64 | 180 W | $ 899 |
| TR (X) | 12 / 24 | 3.5 / 4.3 | (MB) | 4x 2933 | 64 | 180 W | $ 649 |
| Ryzen 3000 | |||||||
| Ryzen 9 3950 X | 16 / 32 | 3.5 / 4.7 | (MB) | 2x 3200 | 24 | (W) | $ 749 |
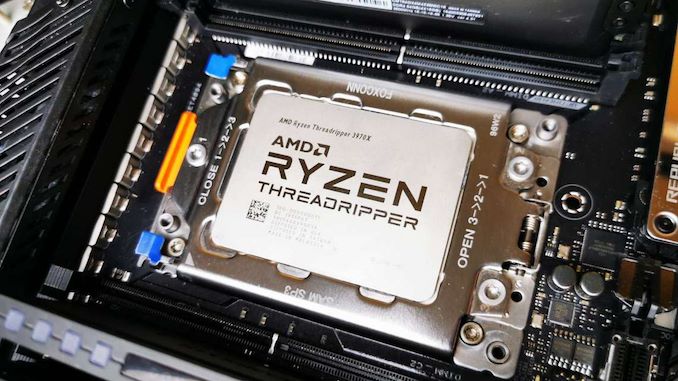
Both of our new TR CPUs have a 280 W TDP, which means they will require substantial cooling regardless of the system they are in. This is a step higher than the peak 250 W TDP we saw with previous generation Threadripper processors, as we are probably approaching a realistic limit as to how high consumer processor power numbers should go without sticking them into a server. This means that the new TRX 40 motherboards are built to be hard and tough, and also support overclocking.

AMD is pricing these two processors at $ 1399 and $ 1999, which also means that AMD’s high-end desktop processors start at a price (and a core count) above where Intel’s HEDT market finishes. Intel’s best chip in this market is the Core i9 – 10980 XE, which has 18 cores and an OEM price of $ 979, which is a way below the TR 3960 X with 24 cores and a retail price of $ 1399. For the first time in living memory, AMD and Intel are launching their CPUs on the same day, and you can catch ourseparate Core i9 – 10980 XE reviewat AnandTech today.
New Socket: sTRX4
One of the key messaging when AMD launched its first Ryzen processors was set to be the longevity of its consumer platforms. Technically the mainstream Ryzen AM4 socket has now gone through four generations of products, and if it weren’t for some poor BIOS choices in the early days, every AM4 motherboard should have been able to support the oldest to the newest AM4 processor. But it does mean a single socket has scaled from a peak of 4 cores when it was first launched all the way to 16 cores.
With Threadripper, it has been a little different. The transition from PCIe 3.0 to PCIe 4.0 has been a tough one to manage, especially when trying to keep parity with sockets and chipset compatibility. The main issue has been PCIe 4.0 validation: supporting PCIe 4.0 with the traces on a motherboard is difficult to the point that the board has to be built with PCIe 4.0 in mind in order to adequately qualify. On top of that, AMD has seen an opportunity to usurp the competition, and has changed the CPU-to-chipset bandwidth link from PCIe 3.0 x4 to PCIe 4.0 x8, quadrupling the total amount of CPU-to-chipset bandwidth available. This is ultimately what breaks compatibility between the previous Threadripper motherboards and the new Threadripper motherboards.
In order to cater for Zen 2, there are also some pin-out changes, however AMD stated that they kept the physical socket the same. What was surprising is that AMD stated that they kept the keying, the little notches that make it easier to see if a CPU is / isn’t supported, the same as well. This means that you can physically fit a new TR CPU in an old motherboard and vice versa. When asked what would happen if you did, AMD said that the system will just refuse to boot. I won’t be the first one to try that, in case the magic smoke appears.
From our pre-briefings, we’ve identified 12 new sTRX4 motherboards bearing the TRX 40 name for new TR3 users to get hold of. These are all pretty expensive, in order to both support the CPUs and have the latest technology, and we will have our overview report on these out later this week. Stay tuned for that.
Competition for 3rdGeneration Threadripper
In each of these reviews, we try and take a look at what CPUs our new hardware is going to compete against. In this instance, AMD has zero competition from Intel without going into Intel’s enterprise range of hardware. When AMD starts at 24 – cores and $ 1399, while Intel finishes at 18 – cores and $ 979, there is no overlap here – the price difference is substantial enough for each side of the equation not to be involved with each other. If we started looking into the Xeon range from Intel, we’re adding in RDIMM support which TR3 doesn’t have, and the added cost of RAS features and vPro etc.
| Intel vs AMD HEDT |
|||
| Core i9 – 10980 XE |
AnandTech | TR (X) |
TR (X) |
| 18 / 36 | Cores / Threads | 24 / 48 | 32 / 64 |
3.0 GHz
| Base Frequency |
3.8 GHz
| 3.5 GHz |
|
4.6 / 4.8 GHz | Turbo Frequency | 4.5 GHz | 4.7 GHz |
| 18 MB | L2 Cache | 12 MB | 16 MB |
| 24. 75 MB | L3 Cache | (MB) | (MB) |
| 256 GB | DRAM Capacity | (GB) | (GB) |
| DDR4 – 2933 | DRAM Frequency | DDR4 – 3200 | DDR4 – 3200 |
| 48 | PCIe Lanes | 64 | 64 |
| (W) | TDP | 280 W | (W) |
| $ 979 (1ku) | Price | $ 1399 | $ 1999 |
Technically I’m going to pull one CPU out here, the Xeon W – 3175 X. This is a 28 – core unlocked processor that Intel launched last year to much fanfare, but with four less cores than the (X and another ) % in cost, well, the benchmarks speak for themselves.
| CPU Pricing | ||||
| AMD (MSRP Pricing) |
Cores | AnandTech | Cores | Intel * (OEM Pricing) |
| $ 2000 | 28 / 56 | Xeon W – (X) ($ 2999) | ||
| TR (X) $ 1999) | 32 / 64 | $ 1750 – $ 1999 | ||
| $ 1500 – $ 1749 | ||||
| TR (X) $ 1399) | 24 / 48 | $ 1250 – $ 1499 | ||
| $ 1000 – $ 1249 | ||||
| $ 900 – $ 999 | 18 / 36 | Core i9 – 10980 XE ($ 979) | ||
| $ 800 – $ 899 | ||||
| (Ryzen 9) ************************************************************************************************************************************************************************************************************************************ (X) ($ 749) | 16 / 32 | $ 700 – $ 799 | 14 / 28 | Core i9 – (X) $ ) |
| $ 600 – $ 699 | 12 / 24 | Core i9 – (X) $ 689) | ||
| $ 550 – $ 599 | 10 / 20 | Core i9 – (X) $ 590) | ||
| $ 500 – $ 549 | 8 / 16 | Core i9 – 9900 KS($ 513) | ||
| Ryzen 9 (X) $ 499) | 12 / 24 | $ 450 – $ 499 | 8 / 16 | Core i9 – (K / F) $ 488) |
| $ 400 – $ 449 | ||||
| Ryzen 7 (X) $ 399) | 8 / 16 | $ 350 – $ 399 | 8/8 | Core i7 – (K / F) $ ) |
| Ryzen 7 (X) $ 329) | 8 / 16 | $ 300 – $ 349 | ||
| $ 250 – $ 299 | 6/6 | Core i5 – (K) $ 262) | ||
| Ryzen 5 (X) $ 249) | 6 / 12 | $ 200 – $ 249 | ||
| Ryzen 5 3600 ($ 199) | 6 / 12 | Below $ 200 | 4/4 | Core i3 – (K) $ ) |
| * Intel quotes OEM / tray pricing. Retail pricing will sometimes be $ 20 – $ 50 Higher. | ||||
Ultimately AMD’s competition for the new Threadripper processors are the old Threadripper processors: the 32 – core 3970 X can compete against the 32 -core 2990 WX. But this isn’t so much of a competition as an evolution: the 3970 X has a newer Zen 2 core for more IPC, a higher frequency, a unified memory system, and supports PCIe 4.0. On paper, you’d say that previous Threadripper processors pale in comparison. There’s going to be a lot of that in our following benchmarks.
Power Consumption
One of our key conclusions from our Ryzen 9 3950 X review is that AMD’s TDP number on the box was now somewhat a blurred line, with the processor instead taking the ‘Package Power Tracking’ or PPT value as its true peak power consumption. This meant that for a processor to have 105 W TDP on the box, the default PPT of 142 W meant that we saw power consumption around 142 W rather than 105 W. One concern going into this review is that AMD would take a similar line with the Zen 2-based Threadripper parts as well.
Both of the TR 3960 X and TR 3970 X processors have a list box TDP of 280 W, which is a new ‘record’ for high power consumption consumer CPU. In the enterprise space we see some specialist processors break the 400 W barrier, but those CPUs exist in environments with a variety of cooling methods and sound isn’t much of a concern: these AMD processors will have to live in a box under someone’s desk, there has to be a point where the TDP is too much. Last AMD generation was 250 W, this one is 280 W: if we’re not there already, then this should be a practical limit. AMD of course recommends liquid cooling with a good pump and a big radiator, so anyone buying one of these processors should look into spending at least another $ 120 on a good liquid cooling system.

AMD’s Ryzen Master
For our power consumption metrics, we performed our usual testing: using an affinity mask to limit the cores in use, implement a high-powered workload, and then measure the power readings 30 seconds in. We take the power readings from the processor itself, using the internal registers that are designed to regulate how much the processor does a form of turbo but also regulate temperatures and so forth. This method is broadly accurate, assuming the motherboard supports the external reporting of these values, but depending on the processor family it also gives us insights into how much power is being derived from the cores individually and the package as a whole.
Here’s what we get for the 24 – core 3960 X:

When a single core is active, it consumes ~ 13 .5 watts. This slowly goes down when more cores get loaded, but at 6 cores loaded we are still consuming ~ 12 watts per core. Even at 16 cores loaded, we’re still around 10 watts per core. This is pretty impressive. At full core loading, we’re fluctuating between 6 and 11 watts per core, as workloads get moved around to manage core loading.

From the peak power perspective, we hit 280 W with 22 cores loaded. It drops off a bit after that, like we saw with the Ryzen 9 3950 X, but not by much at this time. It should be noted that as we reach these higher values, out of those 280 W, around 205 W is being used by the cores, while 75 W or so is for everything else: that means memory controllers, PCIe root complexes, and the infinity fabric. This 75 W value doesn’t vary that much, starting at 68 W even at single core load. This indicates that either IF doesn’t take much power as more cores are used, or it is on all the time.
Moving to the 3970 X, and we see a similar picture:

With more cores, the power is spread around a lot more. One core loaded tops out at 13 watts, and at 11 cores loaded we can still manage above 10 watts per core. When fully loaded, we move down to as low as 3 W per core, but it does average out to around 6 watts per core. Checking the frequency at this loading and despite the 3.7 GHz base frequency, we actually have all the cores at 4.0 GHz. 32 cores at 4.0 GHz? Yes please.
 ******
The peak power metrics rise to just over 280 W when we hit 23 cores loaded and stay there, with no dip after hitting the peak. It would seem that the 3970 X appears better built in that regard.
If we comment on the power between the cores and everything else, we again get a 205 – 210 W value for the power in the cores. This leaves 75 W or so for the rest of the chip, almost identical to the 3960 X, and again this doesn’t waver much from 1 core loaded to all-cores loaded.
What will be interesting to see will be when we get the 3990 X in to test as comparison . I expect that 75 W value to go up – even if it goes to 100 W, that leaves 180 W for 64 cores, or around 3 W per core. Based on my estimates, we could be looking at anywhere from 3.0-3.5 GHz per core, which actually fits in nicely with the frequencies of the EPYC 7H 12 which is also a 64 – core 280 W part, but for the high performance compute market.
When comparing peak power consumption to all the other CPUs in our review, as expected our new CPUs are near the top of the charts.
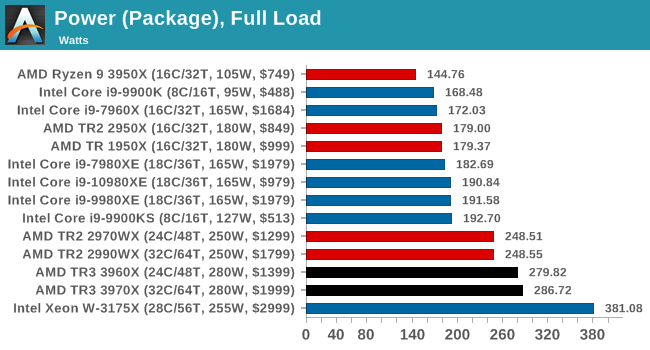
Only the unlocked 28 – core from Intel peaks at a higher power, but funnily enough, that should only have a 255 W TDP. So for four more cores, AMD’s peak power is still 100 W below Intel’s. That’s the ‘power’ of the 7nm process node and some good quality chiplets.
Zen 2 Platform for HEDT – Improvements over Last-Gen
Section by Andrei Frumusanu
The platform architecture between of new Threadripper 3000 series is fundamentally different, and a massive departure from what we’ve seen in the past on the first and second generation Threadripper products. Previously, AMD still made use of its monolithic die design used in Zen and Zen Ryzen, Threadripper and EPYC products. The approach was an economically smart one for AMD in regards to having to design only a single silicon die that would be used across the three product lines, however it had some fundamental technical disadvantages when it came to power efficiency as well as having to make some performance compromises.
The biggest disadvantage exhibited by the Threadripper 2000 series was the platform’s weakness in regards to its memory architecture, an issue that was particularly prevalent in the (-core Threadripper) WX.As explained in our review of the TR2 products last year, the main problem with that SKU was that in order to achieve a 32 – core product, AMD had to make use of 4 “Zeppelin” dies. Unlike the server-oriented SP3 socket however, Threadripper products come on the TR4 platform. While the two sockets are physically identical, they’re electrically incompatible with each other. In practice, the biggest difference between the two platforms is the fact that Threadripper products supports 4-channel memory setups, while the EPYC variants support the full 8-channel memory configuration possible.
The main conundrum for a product such as the 2990 X which had to make use of 4 dies, each integrating 2 memory controller channels, is the decision on how you split up the memory controller setup between the dies and choose which 4 active controllers you’ll end up using. AMD’s approach here is that instead of using only one memory controller per die, the company chose to have two dies each with both memory controllers active, whilst the other two dies wouldn’t have any memory controllers enabled at all. The issue here is that the CPUs located on these dies would only have to access memory by hopping through the infinity fabric to the adjacent dies which did have memory controllers, and incur quite a large memory latency and bandwidth penalty. This penalty was large enough, that in situations where applications weren’t properly NUMA-aware and scaled across all core, the 2990 WX ended up sometimes lagging behind the 16 – core 2950 X in performance.
Chiplet Architecture To The Rescue
Of course, AMD was aware of this drawback, but wasn’t planning to stay with this compromise forever. The new Ryzen 3000 series earlier this summer introduced the chiplet architecture for the first time ever, with some quite astounding success. The main differences here is that AMD is decoupling the actual CPU cores and cluster from the rest of the traditional SoC. The CPU chiplet contains nothing more than the CPU cores themselves, the CPU clusters L3 caches, and the I / O interface which communicates with the rest of the “traditional” system, which is now located on a separate silicon die.

AMD Ryzen 3000 Consumer IOD – CreditFritzchens Fritz
For the Ryzen 3000 products, this IO die is seemingly quite familiar in terms of design to what we saw in the first- and second-generation Zen architecture products. We find your various I / O IP blocks which take care of various connectivity such as USB, Ethernet, SATA, alongside the critical components such as the PCIe controllers and of course the memory controllers. In general, what’s found on the Ryzen 3000 IOD isnt all too different in functionality than what we previously saw on the monolithic Zen dies from past years – of course, except for the CPUs themselves.
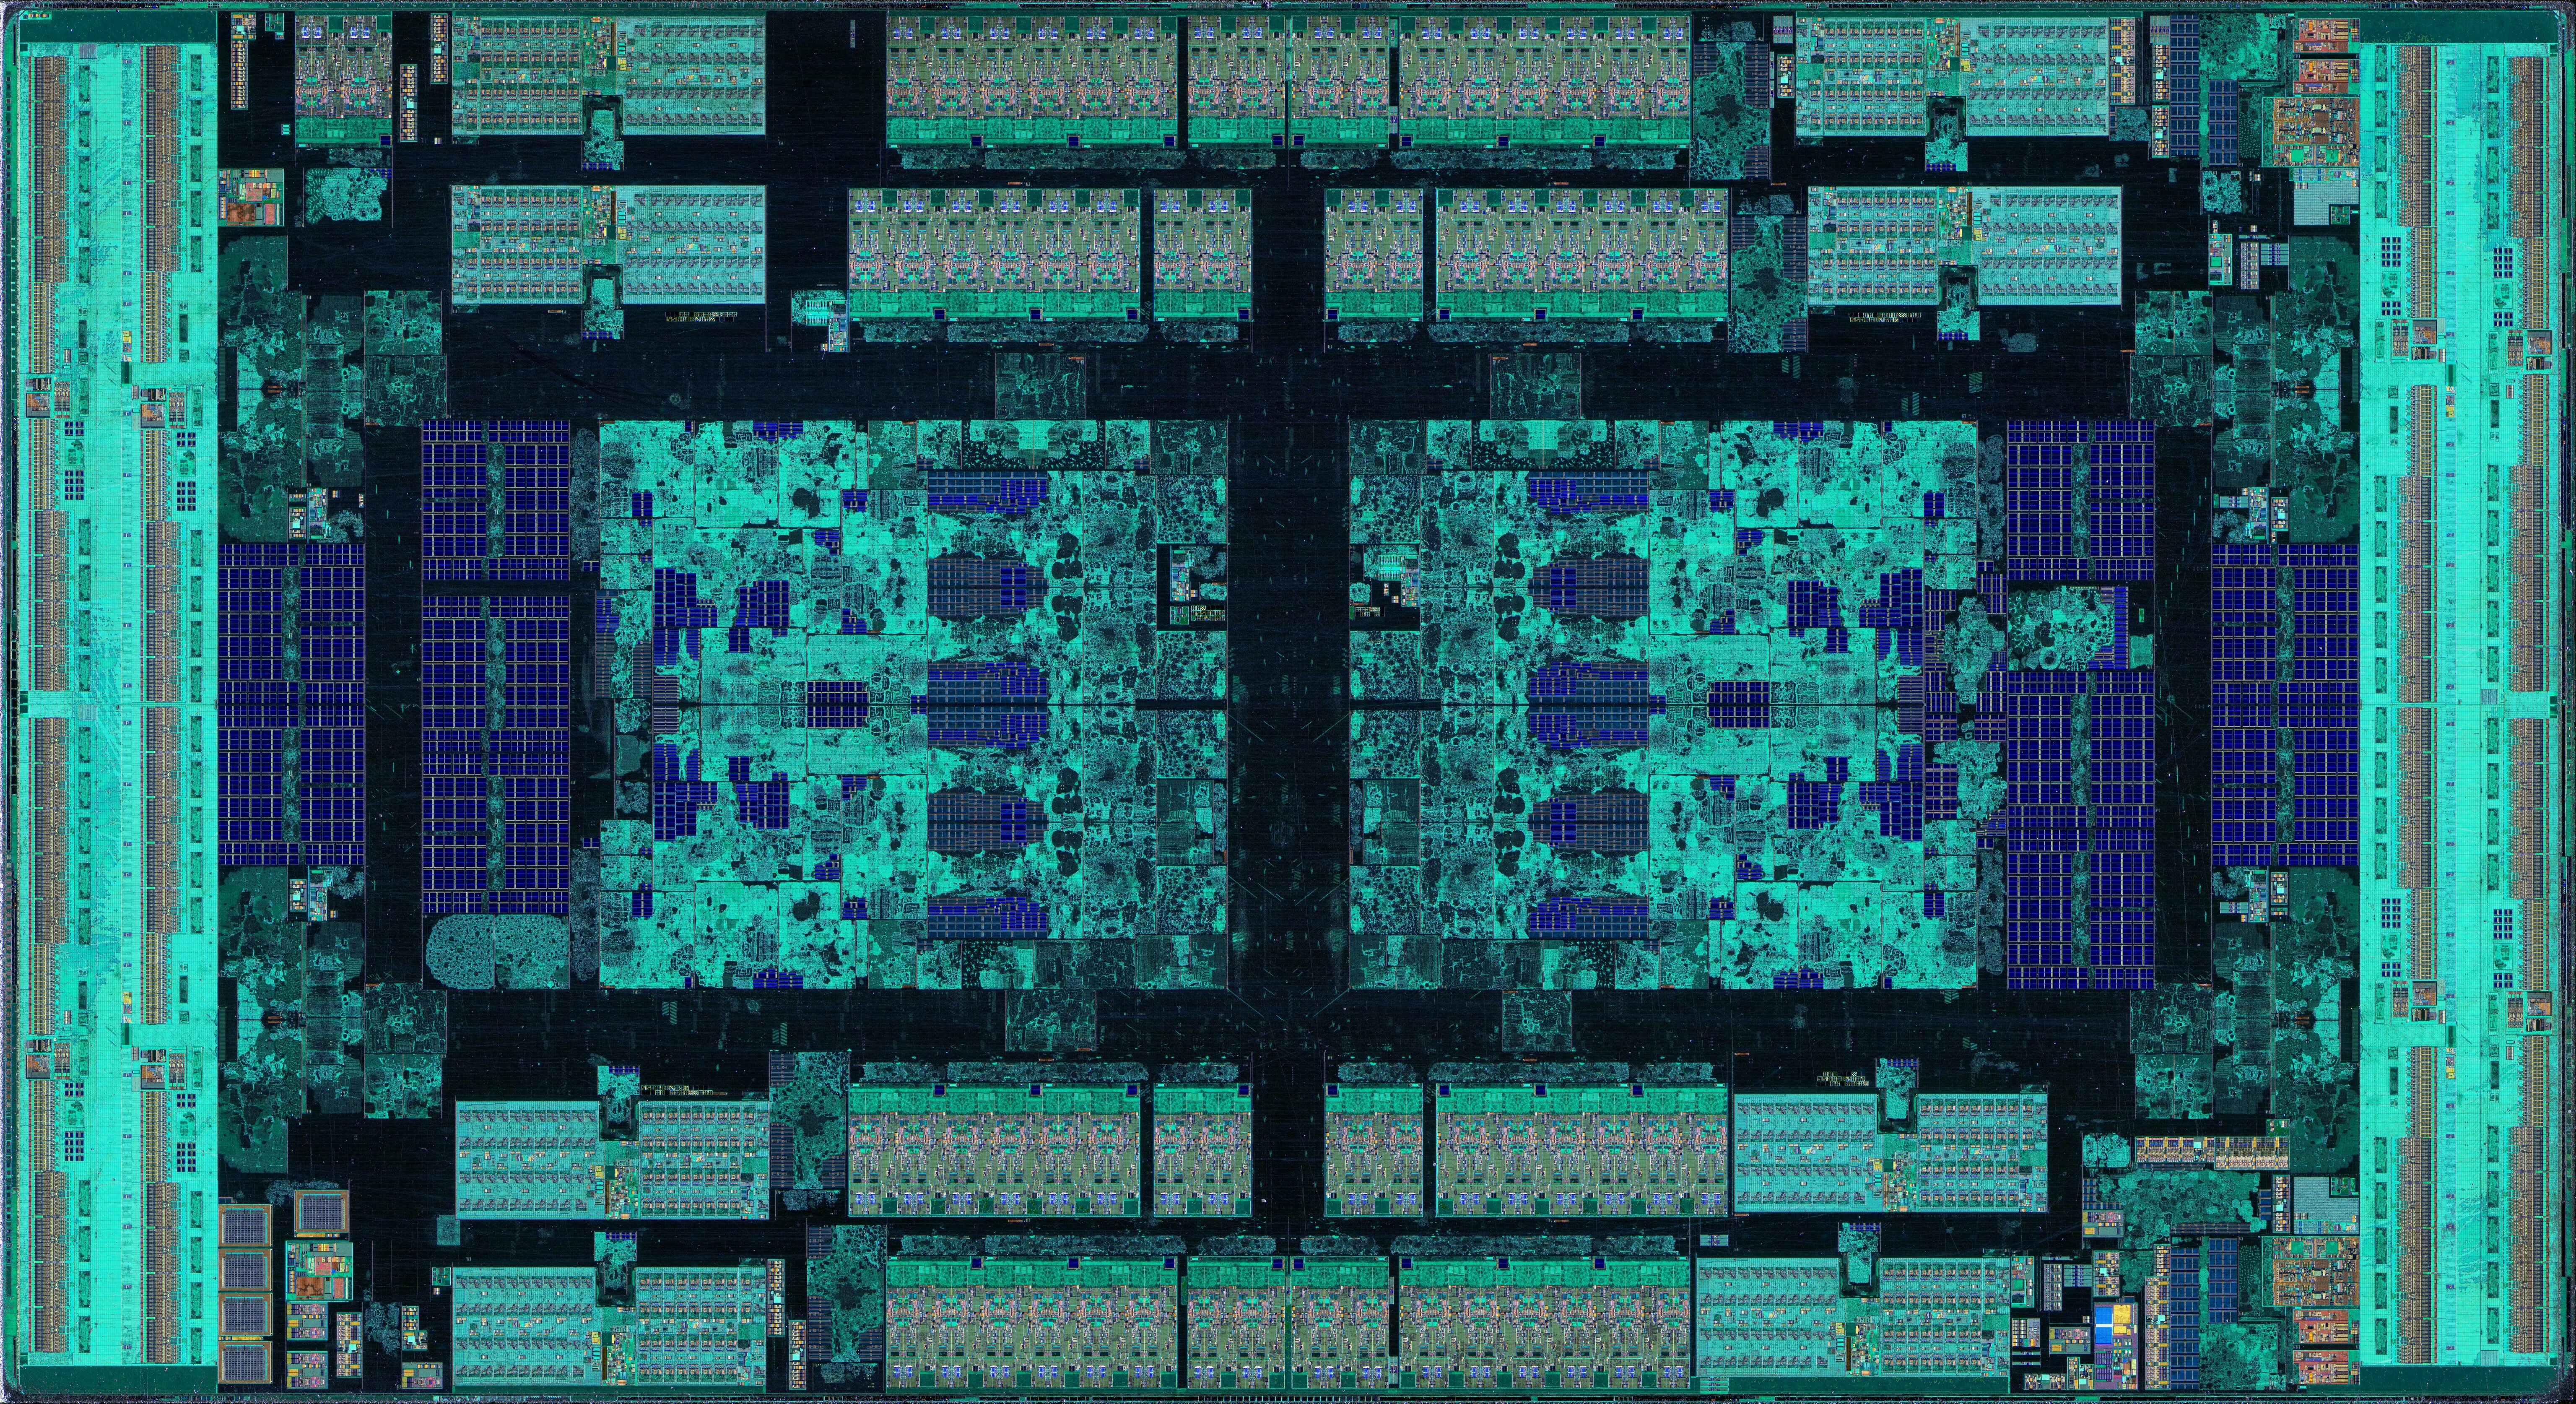
AMD EPYC2 / Threadripper 3000 sIOD – CreditFritzchens Fritz
As we move on to the new Threadripper 3000 products (and new EPYC 2 processors), we however see the AMD’s main chiplet design advantage. Although the new Threadripper and EPYC products use the very same 7nm CPU chiplet dies (CCDs), they are using a different IO die, what seems to be called by AMD as the sIOD (server IO die?).
What’s interesting about the sIOD is that it’s not much of a “monolithic” design, but actually more similar to four consumer IO dies put together on one chip. In the above die shots (credit toFritzchens Fritz), we actually see that AMD is employing an identical physical design of large parts of the chip’s IP blocks, with the main “central” block cluster going as far as being essentially identical. Of course, the layout of the various surrounding blocks is quite different. AMD here is essentially reusing design resources across its product ranges.
While the chip isn’t completely mirrored – there are still distinct unique IP blocks on each quarter of the die, it is in fact correct to say that it’s divided into quarters. These “quadrants” are in fact physically and logically separate from each other. Where this is important to consider, is in regards to the memory layout. In fact, logically, the layout is actually quite similar to what we’ve seen on the previous generation Threadripper and EPYC chips in terms of memory controller and CPU cluster distinction. Each quadrant still has its own two local memory controller channels, and the CPU CCXs connected to this quadrant have the best latency and bandwidth to memory. The CPUs accessing memory controllers of a different quadrant still have to do this via a hop over the infinity fabric, the biggest difference for this generation however is that instead of this hop being across different dies on the MCM package, it all remains on the same silicon die.
For Rome, AMD had explained that the latency differences between accessing memory on the local quadrant versus accessing remote memory controllers is ~ 6-8ns and ~ 8 – 10 ns for adjacent quadrants (because of the rectangular die, the quadrants adjacent on the long side have larger latency than adjacents quadrants on the short side), and ~ 20 – 25 ns for the diagonally opposing quadrants. While for EPYC, AMD provides options to change the NUMA configuration of the system to optimize for either latency (quadrants are their own NUMA domain) or bandwidth (one big UMA domain), the Threadripper systems simply appear as one UMA domain, with the memory controllers of the quadrants being interleaved in the virtual memory space.
The interesting question here of course is, how is this UMA domain setup for the Threadripper 3950 X and 3970 X? The SKUs come with 4 chiplets each, with the 3950 X employing 3 cores per CCX, totalling 24 cores, and the (X employing 4 cores per CCX, totalling) cores. However, what we don’t know is how these chiplets are divided and populated across the sIOD’s quadrants. In theory, one could have one chiplet and one memory controller per quadrant – or one could have just two fully populated quadrants with the other two quadrants disabled. Given we have numbers on a fully populated EPYC 7742 to compare against, and that the diagonally opposing quadrant latency penalty is quite big, we should be able to estimate the implementation based on the latency results.
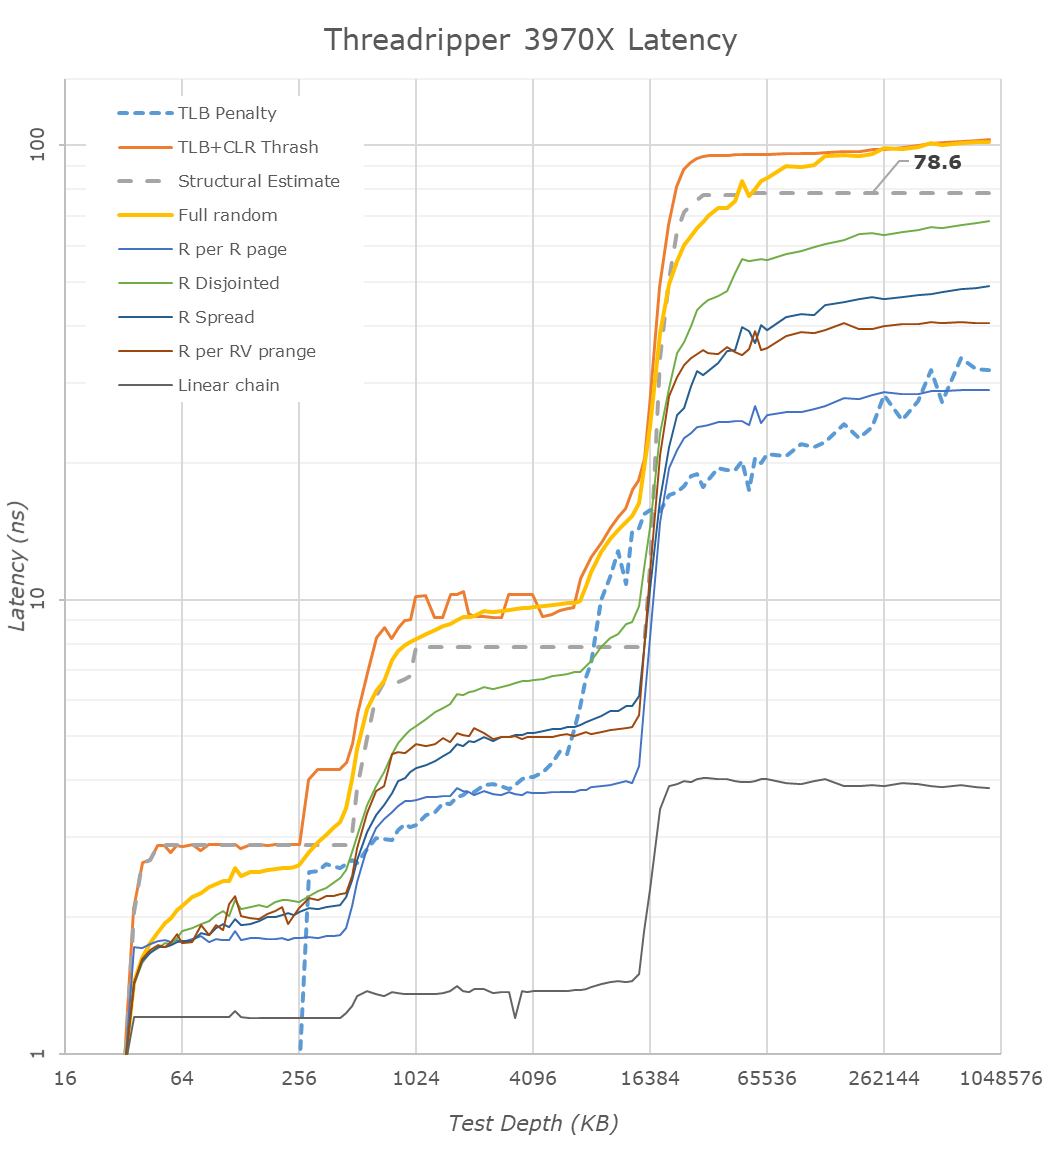
Looking at the latency results, there’s a few comparisons to make. In regards to the L1, L2 and L3 performance, I refer to ouroriginal Zen2 analysis in our Ryzen 3000 review article. The numbers here don’t change, which is natural as we’re talking about the very same CPU chiplet across the different product lines.
Going out of the CCD, the DRAM latency is the most interesting difference that we need to have a closer look at. Comparing the new Threadripper 3970 X to the 2950 X we see a latency degradation of 16. 2ns, with the structural DRAM latency rising from 62. 2ns to 78. For this comparison we’re using the very same DRAM sticks with identical timings between the Ryzen and two Threadripper platforms, so any differences here are solely due to the architectural differences of the platforms.
This degradation is actually to be expected. The third generation Threadripper degrades in two aspects compared to its predecessor: First of all, the chiplet architecture does incur a latency penalty as the separation of the CPU cores onto a different silicon die comes with a latency penalty. Secondly, in the first and second generation Threadripper products, each CPU had access to its own die memory controller by default, and it wasn’t possible to use an UMA setup. The third-gen Threadripper comes with an UMA setup by default, and the fact that the IOD is interleaving memory accesses across the quadrant memory controllers again adds another latency penalty.
Looking at the differences between the EPYC 7742 running in NPS4 mode and the new 3970 X, we however see that the new TR 3000 platform has a definitive latency advantage of almost 25 ns – albeit we’re no longer running apples-to-apples here in regards to the DRAM.
Finally, the most interesting comparison is using the very same DRAM and timings between a Ryzen 3000 processor and the new 3970 X. Using an 3700 X we had at hand, the latency penalty for the new TR chip is “Only” 9.2ns, rising from 69. 4ns to 78. Maybe I might sound a bit optimistic here, based on the Rome numbers from earlier this summer I had expected some quite worse results for the new Threadripper 3000 series, so I see this result to be actually quite good. While we don’t have definitive confirmation, it does look like the new 24 and 32 – Core Threadripper 3000 SKUs are using only two adjacent quadrants of the sIOD.
Of course, the structural latency degradations here don’t necessarily translate to performance degradations. As we saw on the Ryzen 3000 products, AMD’s new doubled L3 cache as well as improved prefetchers have managed to more than compensate for the worse structural latency, actually increasing the memory performance of the new Zen2 chips.
Test Bed and Setup
As per our processor testing policy, we take a premium category motherboard suitable for the socket, and equip the system with a suitable amount of memory running at the manufacturer’s maximum supported frequency. This is also typically run at JEDEC subtimings where possible. It is noted that some users are not keen on this policy, stating that sometimes the maximum supported frequency is quite low, or faster memory is available at a similar price, or that the JEDEC speeds can be prohibitive for performance. While these comments make sense, ultimately very few users apply memory profiles (either XMP or other) as they require interaction with the BIOS, and most users will fall back on JEDEC supported speeds – this includes home users as well as industry who might want to shave off a cent or two from the cost or stay within the margins set by the manufacturer. Where possible, we will extend out testing to include faster memory modules either at the same time as the rev iew or a later date.
| Test Setup | |
| AMD TR3 | Threadripper 3970 X Threadripper (X) |
| Motherboard | ASUS ROG Zenith II Extreme (BIOS 0601) |
| CPU Cooler | Thermaltake Riing (CLC) |
| DRAM | Corsair Dominator Platinum RGB 8×8 GB DDR4 – 3200 |
| GPU | |
| PSU | Corsair AX 860 i |
| SSD | Crucial MX 500 2TB |
| OS | |
For our motherboards, we are using the latest firmware. It should be noted that our Intel tests do not have the latest Intel security updates for JCC and others, as the motherboard vendors for the models we used have not implemented them yet.
The latest AMD TR3 benchmarks were run by Gavin Bonshor, while I attended Supercomputing in Denver last week. Unfortunately both Intel and AMD decided to sample processors before the annual trade show conference, with launches only a couple of days after the show finished. As a result, our testing has been split between Gavin and myself, and we have endevoured to ensure parity through my automated testing suite.
Also, our compile test seems to have broken itself when we used Windows 10 1909, and due to travel we have not had time to debug why it is no longer working. We hope to get this test up and running in the new year, along with an updated test suite.
We must thank the following companies for kindly providing hardware for our multiple test beds. Some of this hardware is not in this test bed specifically, but is used in other testing.
CPU Performance: Rendering Tests
Rendering is often a key target for processor workloads, lending itself to a professional environment. It comes in different formats as well, from 3D rendering through rasterization, such as games, or by ray tracing, and invokes the ability of the software to manage meshes, textures, collisions, aliasing, physics (in animations), and discarding unnecessary work . Most renderers offer CPU code paths, while a few use GPUs and select environments use FPGAs or dedicated ASICs. For big studios however, CPUs are still the hardware of choice.
All of our benchmark results can also be found in our benchmark engine, (Bench) .
Corona 1.3: Performance Render
An advanced performance based renderer for software such as 3ds Max and Cinema 4D, the Corona benchmark renders a generated scene as a standard under its 1.3 software version. Normally the GUI implementation of the benchmark shows the scene being built, and allows the user to upload the result as a ‘time to complete’.
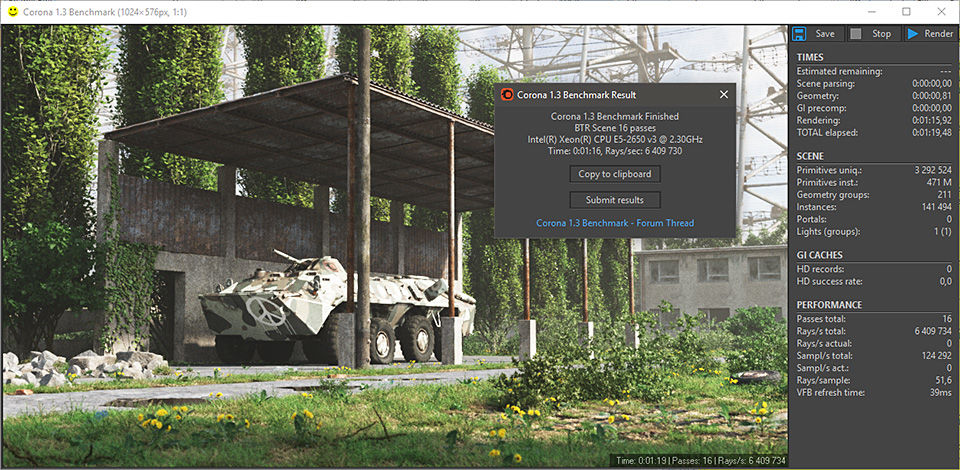
We got in contact with the developer who gave us a command line version of the benchmark that does a direct output of results. Rather than reporting time, we report the average number of rays per second across six runs, as the performance scaling of a result per unit time is typically visually easier to understand.
The Corona benchmark website can be found athttps: // corona- renderer.com/benchmark
Being fully multithreaded, we see the order here follow core counts. That is except for the 32 – core 2990 WX sitting behind the 24 – core 3960 X, which goes to show how much extra performance is in the new TR generation.
Blender 2. (b: 3D Creation Suite)
A high profile rendering tool, Blender is open-source allowing for massive amounts of configurability, and is used by a number of high-profile animation studios worldwide. The organization recently released a Blender benchmark package, a couple of weeks after we had narrowed our Blender test for our new suite, however their test can take over an hour. For our results, we run one of the sub-tests in that suite through the command line – a standard ‘bmw 27 ‘scene in CPU only mode, and measure the time to complete the render.
Blender can be downloaded athttps: //www.blender .org / download /
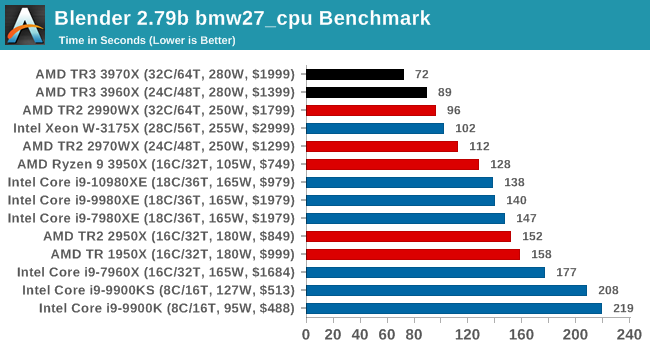
We have new Threadripper records, with the 3970 X almost getting to a minute to compute. Intel’s nearest takes almost as long, but does only cost half as much. Again, the 3960 X puts the 2990 WX in its place.
LuxMark v3.1: LuxRender via Different Code Paths
As stated at the top, there are many different ways to process rendering data: CPU, GPU, Accelerator, and others. On top of that, there are many frameworks and APIs in which to program, depending on how the software will be used. LuxMark, a benchmark developed using the LuxRender engine, offers several different scenes and APIs.
In our test, we run the simple ‘Ball’ scene. This scene starts with a rough render and slowly improves the quality over two minutes, giving a final result in what is essentially an average ‘kilorays per second’.
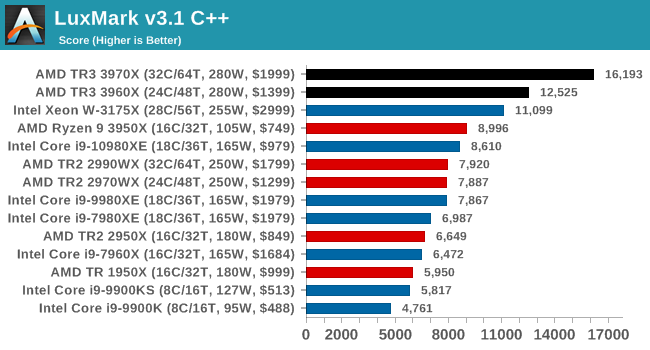
Our LuxMark test again pushes both TR3 processors out in the lead.
POV-Ray 3.7.1: Ray Tracing
The Persistence of Vision ray tracing engine is another well-known benchmarking tool, which was in a state of relative hibernation until AMD released its Zen processors, to which suddenly both Intel and AMD were submitting code to the main branch of the open source project. For our test, we use the built-in benchmark for all-cores, called from the command line.
POV-Ray can be downloaded fromhttp: //www.povray.org/
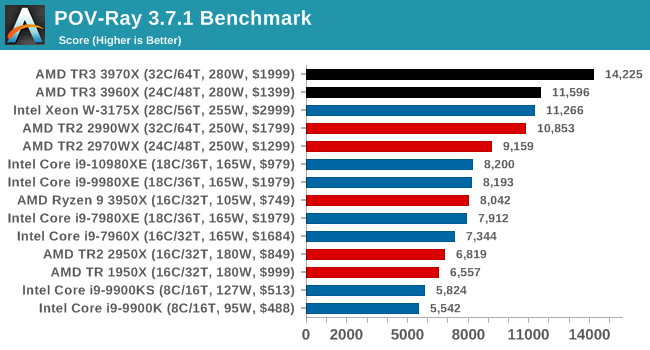
More rendering, more wins for AMD. More losses for the 2990 WX, even though on these tests it still beats the 10980 XE quite easily.
CPU Performance: System Tests
Our System Test section focuses significantly on real-world testing, user experience, with a slight nod to throughput. In this section we cover application loading time, image processing, simple scientific physics, emulation, neural simulation, optimized compute, and 3D model development, with a combination of readily available and custom software. For some of these tests, the bigger suites such as PCMark do cover them (we publish those values in our office section), although multiple perspectives is always beneficial. In all our tests we will explain in-depth what is being tested, and how we are testing.
All of our benchmark results can also be found in our benchmark engine, (Bench) .
Application Load: GIMP 2. 10 4
One of the most important aspects about user experience and workflow is how fast does a system respond. A good test of this is to see how long it takes for an application to load. Most applications these days, when on an SSD, load fairly instantly, however some office tools require asset pre-loading before being available. Most operating systems employ caching as well, so when certain software is loaded repeatedly (web browser, office tools), then can be initialized much quicker.
In our last suite, we tested how long it took to load a large PDF in Adobe Acrobat. Unfortunately this test was a nightmare to program for, and didn’t transfer over to Win 10 RS3 easily. In the meantime we discovered an application that can automate this test, and we put it up against GIMP, a popular free open-source online photo editing tool, and the major alternative to Adobe Photoshop. We set it to load a large 50 MB design template, and perform the load 10 times with 10 seconds in-between each. Due to caching, the first 3-5 results are often slower than the rest, and time to cache can be inconsistent, we take the average of the last five results to show CPU processing on cached loading.
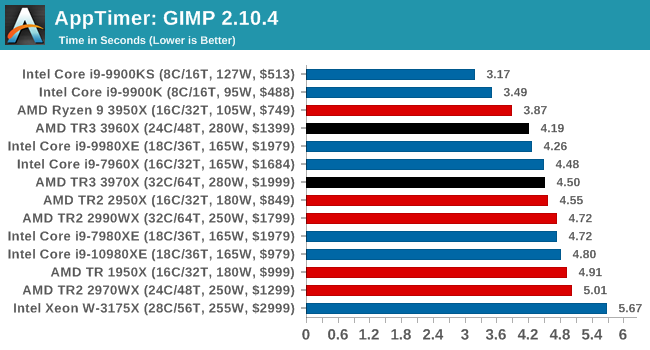
Onto our single threaded tests, and the mainstream hardware with high single thread frequencies wins here, but the 3960 X is leading the rest of the pack. Intel’s 28 – core part here sits last, behind even the 1950 X.
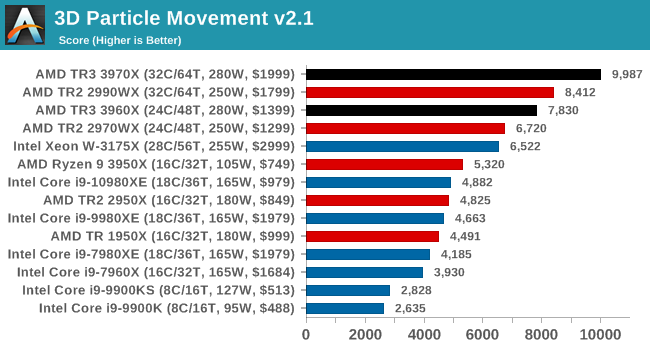
3D Particle Movement v2.1: Brownian Motion
Our 3DPM test is a custom built benchmark designed to simulate six different particle movement algorithms of points in a 3D space. The algorithms were developed as part of my PhD., And while ultimately perform best on a GPU, provide a good idea on how instruction streams are interpreted by different microarchitectures.
A key part of the algorithms is the random number generation – we use relatively fast generation which ends up implementing dependency chains in the code. The upgrade over the naïve first version of this code solved for false sharing in the caches, a major bottleneck. We are also looking at AVX2 and AVX 512 versions of this benchmark for future reviews.
For this test, we run a stock particle set over the six algorithms for 20 seconds apiece, with 10 second pauses, and report the total rate of particle movement, in millions of operations (movements) per second . We have a non-AVX version and an AVX version, with the latter implementing AVX 512 and AVX2 where possible.
3DPM v2.1 can be downloaded from our server:3DPMv2.1.rar(13 .0 MB)
 ******
With non-AVX, AMD’s floating point units put on a great performance.
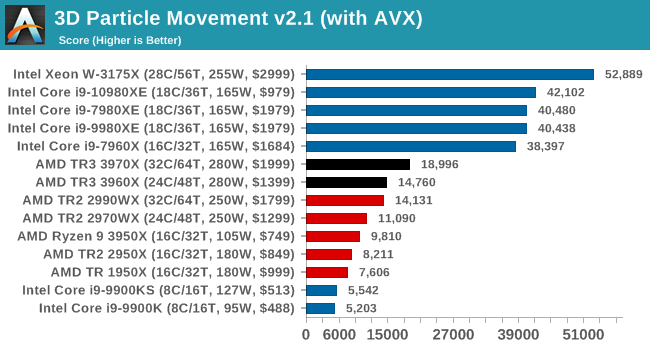 ******
This is a workload that can be AVX 512 accelerated, and this is the main instance where we can see Intel’s CPUs having an advantage.
Dolphin 5.0: Console Emulation
One of the popular requested tests in our suite is to do with console emulation. Being able to pick up a game from an older system and run it as expected depends on the overhead of the emulator: it takes a significantly more powerful x 86 system to be able to accurately emulate an older non-x 86 console, especially if code for that console was made to abuse certain physical bugs in the hard ware.
For our test, we use the popular Dolphin emulation software, and run a compute project through it to determine how close to a standard console system our processors can emulate. In this test, a Nintendo Wii would take around 1050 seconds.
The latest version of Dolphin can be downloaded fromhttps://dolphin-emu.org/
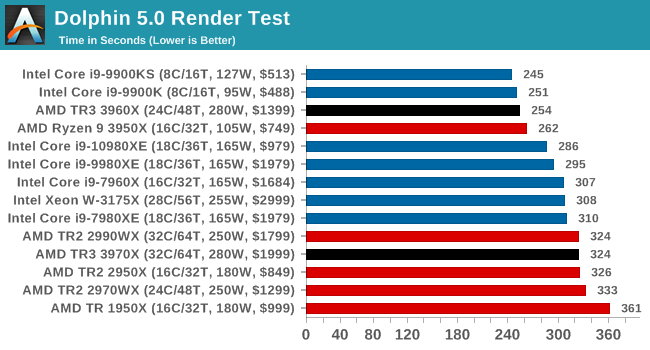
On the single threaded workloads again, and the high frequency mainstream CPUs win here. Interestingly, the 3960 X also puts on a really good show, and actually beats our 3950 X. Interesting.
DigiCortex 1. 20: Sea Slug Brain Simulation
This benchmark was originally designed for simulation and visualization of neuron and synapse activity, as is commonly found in the brain. The software comes with a variety of benchmark modes, and we take the small benchmark which runs a 32 k neuron / 1.8B synapse simulation, equivalent to a Sea Slug.

Example of a 2.1B neuron simulation
We report the results as the ability to simulate the data as a fraction of real-time, so anything above a ‘one’ is suitable for real-time work. Out of the two modes, a ‘non-firing’ mode which is DRAM heavy and a ‘firing’ mode which has CPU work, we choose the latter. Despite this, the benchmark is still affected by DRAM speed a fair amount.
DigiCortex can be downloaded fromhttp://www.digicortex.net/
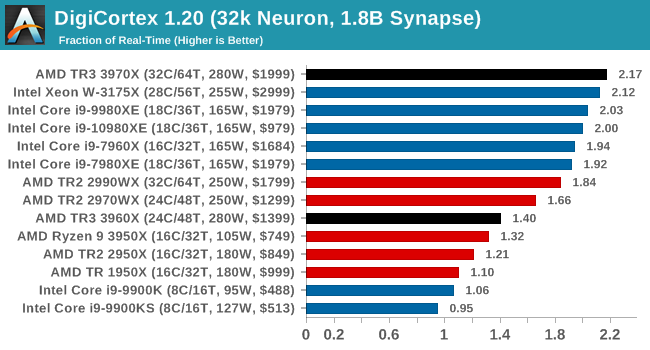
I’m surprised there’s that much difference between the (X and 3960 X here, especially with the 3960 X sitting behind the TR2 processors. Might have to re-run this one to double check. But the 3970 X puts out a commanding lead.
y-Cruncher v0.7.6: Microarchitecture Optimized Compute
I’ve known about y-Cruncher for a while, as a tool to help compute various mathematical constants, but it wasn’t until I began talking with its developer, Alex Yee, a researcher from NWU and now software optimization developer, that I realized that he has optimized the software like crazy to get the best performance. Naturally, any simulation that can take 20 days can benefit from a 1% performance increase! Alex started y-cruncher as a high-school project, but it is now at a state where Alex is keeping it up to date to take advantage of the latest instruction sets before they are even made available in hardware.
For our test we run y-cruncher v0.7.6 through all the different optimized variants of the binary, single threaded and multi-threaded, including the AVX – 512 optimized binaries. The test is to calculate 250 m digits of Pi, and we use the single threaded and multi-threaded versions of this test .
Users can download y-cruncher from Alex’s website:http://www.numberworld.org/y-cruncher/
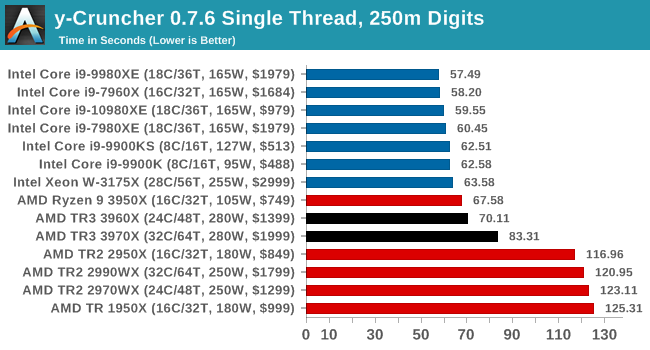
y-Cruncher is also AVX – 512 accelerated, however when all the 32 threads come together in MT mode on AVX2, having that many pushes through 18 cores with AVX – 512.
Agisoft Photoscan 1.3.3: 2D Image to 3D Model Conversion
One of the ISVs that we have worked with for a number of years is Agisoft, who develop software called PhotoScan that transforms a number of 2D images into a 3D model. This is an important tool in model development and archiving, and relies on a number of single threaded and multi-threaded algorithms to go from one side of the computation to the other.
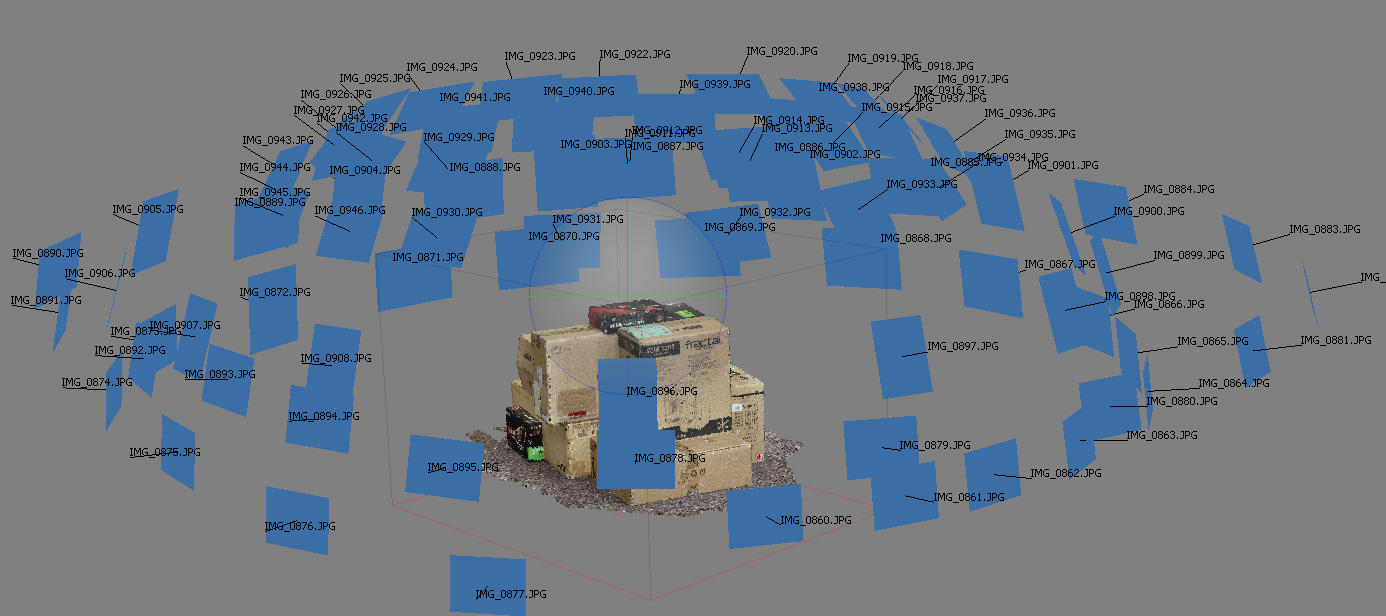
In our test, we take v1.3.3 of the software with a good sized data set of (x) megapixel photos and push it through a reasonably fast variant of the algorithms, but is still more stringent than our 2017 test. We report the total time to complete the process.
Agisoft’s Photoscan website can be found here:http://www.agisoft.com/
New records for Photoscan as well.
CPU Performance: Encoding Tests
With the rise of streaming, vlogs, and video content as a whole, encoding and transcoding tests are becoming ever more important. Not only are more home users and gamers needing to convert video files into something more manageable, for streaming or archival purposes, but the servers that manage the output also manage around data and log files with compression and decompression. Our encoding tasks are focused around these important scenarios, with input from the community for the best implementation of real-world testing.
All of our benchmark results can also be found in our benchmark engine, (Bench) .
Handbrake 1.1.0: Streaming and Archival Video Transcoding
A popular open source tool, Handbrake is the anything-to-anything video conversion software that a number of people use as a reference point. The danger is always on version numbers and optimization, for example the latest versions of the software can take advantage of AVX – 512 and OpenCL to accelerate certain types of transcoding and algorithms. The version we use here is a pure CPU play, with common transcoding variations.
We have split Handbrake up into several tests, using a Logitech C 920 (P) native webcam recording (essentially a streamer recording), and convert them into two types of streaming formats and one for archival. The output settings used are:
- (P) at 6000 kbps constant bit rate, fast setting, high profile
- (p) at 3500 kbps constant bit rate, f aster setting, main profile
- (p) HEVC at 3500 kbps variable bit ra te, fast setting, main profile
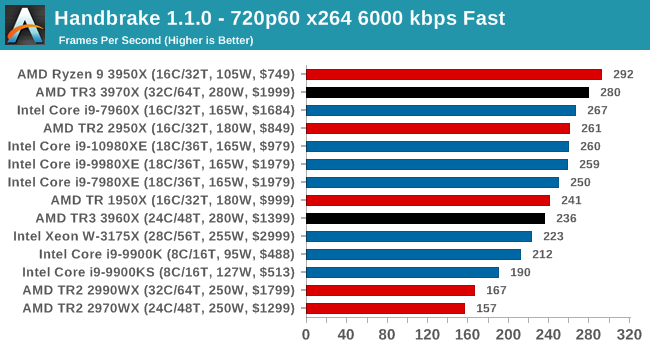
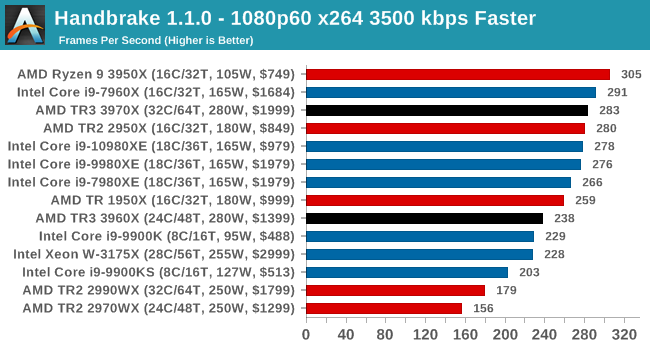
Video encoding is a little varied, based on the variable threaded nature. Certain encoding tests can be more memory sensitive here, or accelerated in different ways, or not scale well with more cores. Either way, TR3 performs a lot better than TR2, but the (X seems the best choice.)
7-zip v 1805: Popular Open-Source Encoding Engine
Out of our compression / decompression tool tests, 7-zip is the most requested and comes with a built-in benchmark. For our test suite, we’ve pulled the latest version of the software and we run the benchmark from the command line, reporting the compression, decompression, and a combined score.
It is noted in this benchmark that the latest multi-die processors have very bi-modal performance between compression and decompression, performing well in one and badly in the other. There are also discussions around how the Windows Scheduler is implementing every thread. As we get more results, it will be interesting to see how this plays out.
Please note, if you plan to share out the Compression graph, please include the Decompression one. Otherwise you’re only presenting half a picture.
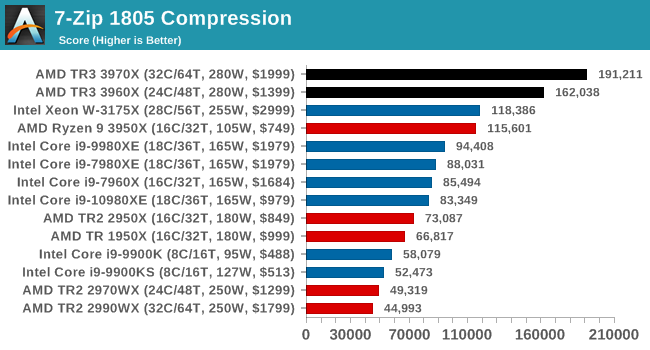
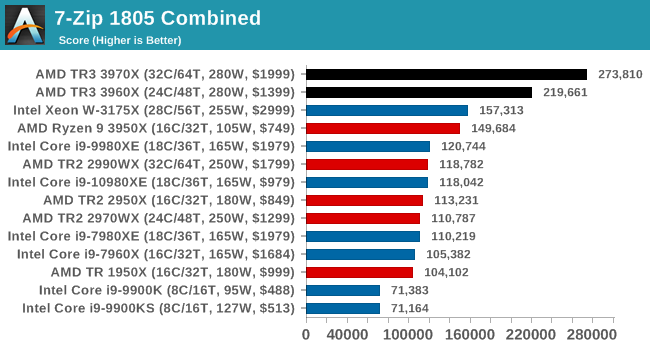
Easily parallel puts the TR3 well ahead of TR2 and Intel.
WinRAR 5. 60 B3 : Archiving Tool
My compression tool of choice is often WinRAR, having been one of the first tools a number of my generation used over two decades ago. The interface has not changed much, although the integration with Windows right click commands is always a plus. It has no in-built test, so we run a compression over a set directory containing over thirty 60 – second video files and 2000 small web-based files at a normal compression rate.
WinRAR is variable threaded but also susceptible to caching, so in our test we run it 10 times and take the average of the last five, leaving the test purely for raw CPU compute performance.
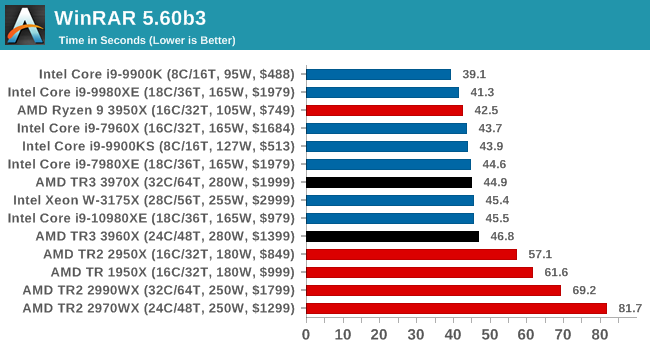
WinRAR is a variably threaded application, and both TR3 processors perform in the same ballpark as anything from Intel. Ideally we should have seen them streak ahead, but we seem to be at a point where CPU frequency or core counts are the limiting factor. At least with Zen 2, there are no issues as there was with Zen 1 / Zen .
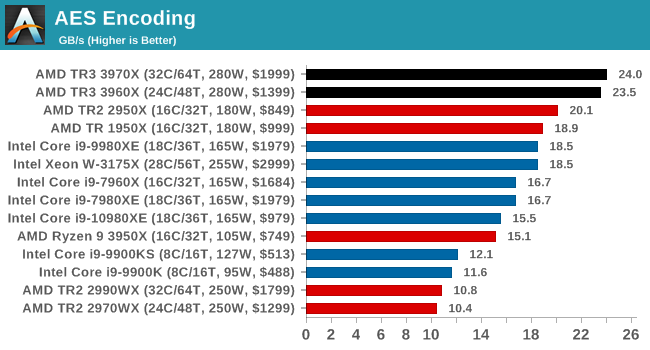
AES Encryption: File Security
A number of platforms, particularly mobile devices, are now offering encryption by default with file systems in order to protect the contents. Windows based devices have these options as well, often applied by BitLocker or third-party software. In our AES encryption test, we used the discontinued TrueCrypt for its built-in benchmark, which tests several encryption algorithms directly in memory.
The data we take for this test is the combined AES encrypt / decrypt performance, measured in gigabytes per second. The software does use AES commands for processors that offer hardware selection, however not AVX – 512.
CPU Performance: Web and Legacy Tests
While more the focus of low-end and small form factor systems, web-based benchmarks are notoriously difficult to standardize. Modern web browsers are frequently updated, with no recourse to disable those updates, and as such there is difficulty in keeping a common platform. The fast paced nature of browser development means that version numbers (and performance) can change from week to week. Despite this, web tests are often a good measure of user experience: a lot of what most office work is today revolves around web applications, particularly email and office apps, but also interfaces and development environments. Our web tests include some of the industry standard tests, as well as a few popular but older tests.
We have also included our legacy benchmarks in this section, representing a stack of older code for popular benchmarks.
All of our benchmark results can also be found in our benchmark engine, (Bench) .
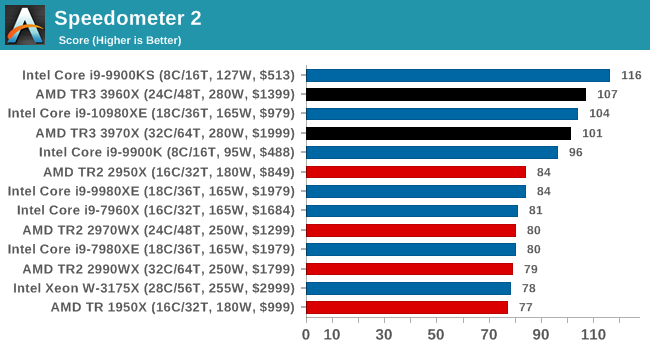
Speedometer 2: JavaScript Frameworks
Our newest web test is Speedometer 2, which is a accrued test over a series of javascript frameworks to do three simple things: built a list, enable each item in the list, and remove the list. All the frameworks implement the same visual cues, but obviously apply them from different coding angles.
Our test goes through the list of frameworks, and produces a final score indicative of ‘rpm’, one of the benchmarks internal metrics. We report this final score.
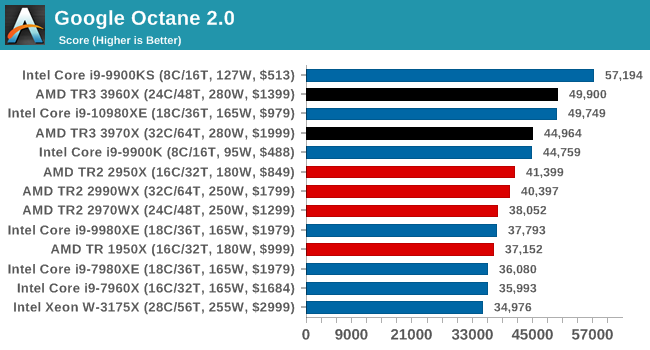
Google Octane 2.0: Core Web Compute
A popular web test for several years, but now no longer being updated, is Octane, developed by Google. Version 2.0 of the test performs the best part of two-dozen compute related tasks, such as regular expressions, cryptography, ray tracing, emulation, and Navier-Stokes physics calculations.
The test gives each sub-test a score and produces a geometric mean of the set as a final result. We run the full benchmark four times, and average the final results.
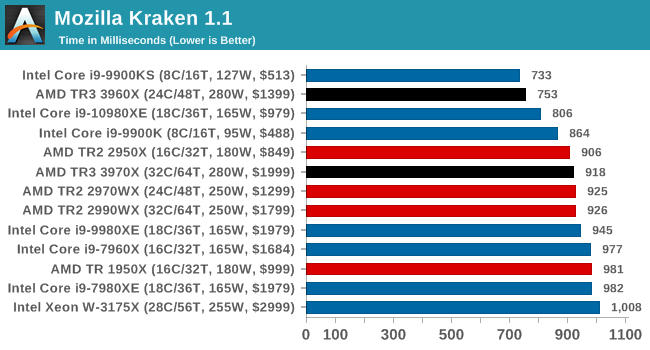
Mozilla Kraken 1.1: Core Web Compute
Even older than Octane is Kraken, this time developed by Mozilla. This is an older test that does similar computational mechanics, such as audio processing or image filtering. Kraken seems to produce a highly variable result depending on the browser version, as it is a test that is keenly optimized for.
The main benchmark runs through each of the sub-tests ten times and produces an average time to completion for each loop, given in milliseconds. We run the full benchmark four times and take an average of the time taken.
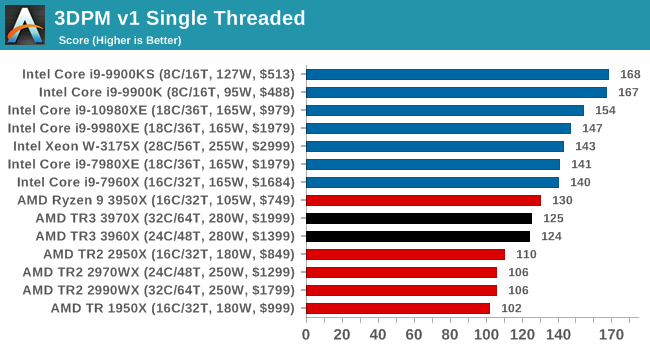
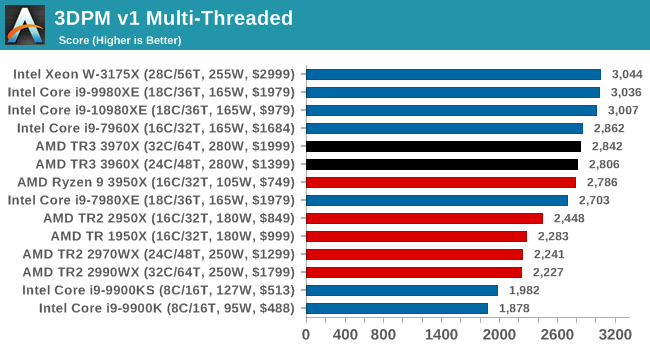
3DPM v1: Naïve Code Variant of 3DPM v2.1
The first legacy test in the suite is the first version of our 3DPM benchmark. This is the ultimate naïve version of the code, as if it was written by scientist with no knowledge of how computer hardware, compilers, or optimization works (which in fact, it was at the start). This represents a large body of scientific simulation out in the wild, where getting the answer is more important than it being fast (getting a result in 4 days is acceptable if it’s correct, rather than sending someone away for a year to learn to code and getting the result in 5 minutes).
In this version, the only real optimization was in the compiler flags (-O2, -fp: fast), compiling it in release mode, and enabling OpenMP in the main compute loops. The loops were not configured for function size, and one of the key slowdowns is false sharing in the cache. It also has long dependency chains based on the random number generation, which leads to relatively poor performance on specific compute microarchitectures.
3DPM v1 can be downloaded with our 3DPM v2 code here: (3DPMv2.1.rar) ( .0 MB)
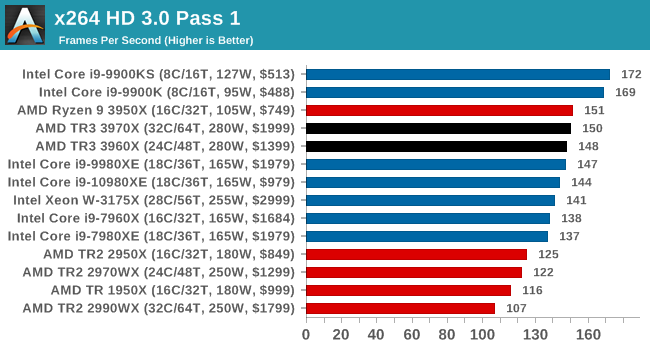
x 264 HD 3.0: Older Transcode Test
This transcoding test is super old, and was used by Anand back in the day of Pentium 4 and Athlon II processors. Here a standardized 720 p video is transcoded with a two-pass conversion, with the benchmark showing the frames-per-second of each pass. This benchmark is single-threaded, and between some micro-architectures we seem to actually hit an instructions-per-clock wall.
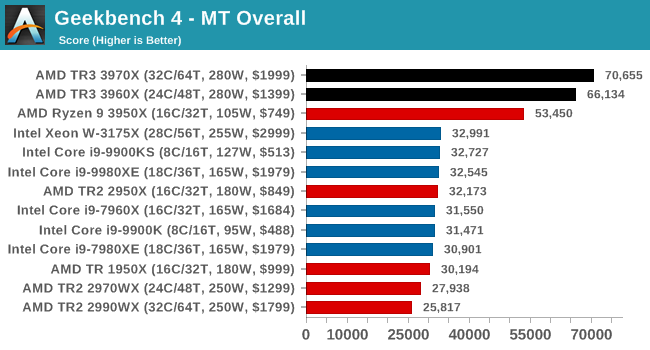
GeekBench4: Synthetics
A common tool for cross-platform testing between mobile, PC, and Mac, GeekBench 4 is an ultimate exercise in synthetic testing across a range of algorithms looking for peak throughput. Tests include encryption, compression, fast Fourier transform, memory operations, n-body physics, matrix operations, histogram manipulation, and HTML parsing.
I’m including this test due to popular demand, although the results do come across as overly synthetic, and a lot of users often put a lot of weight behind the test due to the fact that it is compiled across different platforms (although with different compilers). ******
We record the main subtest scores (Crypto, Integer, Floating Point, Memory) in our benchmark database, but for the review we post the overall single and multi-threaded results.

Gaming: World of Tanks enCore
Albeit different to most of the other commonly played MMO or massively multiplayer online games, World of Tanks is set in the mid – 20 th century and allows players to take control of a range of military based armored vehicles. World of Tanks (WoT) is developed and published by Wargaming who are based in Belarus, with the game’s soundtrack being mainly composed by Belarusian composer Sergey Khmelevsky. The game offers multiple entry points including a free-to-play element as well as allowing players to pay a fee to open up more features. One of the most interesting things about this tank based MMO is that it achieved eSports status when it debuted at the World Cyber Games back in 2012.
.jpg)
World of Tanks enCore is a demo application for a new and unreleased graphics engine penned by the Wargaming development team. Over time the new core engine will implemented into the full game upgrading the games visuals with key elements such as improved water, flora, shadows, lighting as well as other objects such as buildings. The World of Tanks enCore demo app not only offers up insight into the im pending game engine changes, but allows users to check system performance to see if the new engine run optimally on their system.
All of our benchmark results can also be found in our benchmark engine, (Bench) .

Gaming: Final Fantasy XV
Upon arriving to PC earlier this, Final Fantasy XV: Windows Edition was given a graphical overhaul as it was ported over from console, fruits of their successful partnership with NVIDIA, with hardly any hint of the troubles during Final Fantasy XV’s original production and development.
In preparation for the launch, Square Enix opted to release a standalone benchmark that they have since updated. Using the Final Fantasy XV standalone benchmark gives us a lengthy standardized sequence to record, although it should be noted that its heavy use of NVIDIA technology means that the Maximum setting has problems – it renders items off screen. To get around this, we use the standard preset which does not have these issues.

Square Enix has patched the benchmark with custom graphics settings and bugfixes to be much more accurate in profiling in-game performance and graphical options. For our testing, we run the standard benchmark with a FRAPs overlay, taking a 6 minute recording of the test.
All of our benchmark results can also be found in our benchmark engine, (Bench) .
Gaming: Shadow of War
Next up is Middle-earth: Shadow of War, the sequel to Shadow of Mordor. Developed by Monolith, whose last hit was arguably F.E.A.R., Shadow of Mordor returned them to the spotlight with an innovative NPC rival generation and interaction system called the Nemesis System, along with a storyline based on J.R.R. Tolkien’s legendarium, and making it work on a highly modified engine that originally powered F.E.A.R. in 2005.

Using the new LithTech Firebird engine, Shadow of War improves on the detail and complexity, and with free add-on high-resolution texture packs, offers itself as a good example of getting the most graphics out of an engine that may not be bleeding edge. ******
All of our benchmark results can also be found in our benchmark engine, (Bench) .

Gaming: Strange Brigade (DX 12, Vulkan )
Strange Brigade is based in 1903 ‘s Egypt and follows a story which is very similar to that of the Mummy film franchise. This particular third-person shooter is developed by Rebellion Developments which is more widely known for games such as the Sniper Elite and Alien vs Predator series. The game follows the hunt for Seteki the Witch Queen who has arose once again and the only ‘troop’ who can ultimately stop her. Gameplay is cooperative centric with a wide variety of different levels and many puzzles which need solving by the British colonial Secret Service agents sent to put an end to her reign of barbaric and brutality.
 ******
The game supports both the DirectX 12 and Vulkan APIs and houses its own built-in benchmark which offers various options up for customization including textures, anti-aliasing, reflections, draw distance and even allows users to enable or disable motion blur, ambient occlusion and tessellation among others. AMD has boasted previously that Strange Brigade is part of its Vulkan API implementation offering scalability for AMD multi-graphics card configurations.
All of our benchmark results can also be found in our benchmark engine, (Bench) .

Gaming: Grand Theft Auto V
The highly anticipated iteration of the Grand Theft Auto franchise hit the shelves on April (th) , with both AMD and NVIDIA in tow to help optimize the title. GTA doesn’t provide graphical presets, but opens up the options to users and extends the boundaries by pushing even the hardest systems to the limit using Rockstar’s Advanced Game Engine under DirectX 11. Whether the user is flying high in the mountains with long draw distances or dealing with assorted trash in the city, when cranked up to maximum it creates stunning visuals but hard work for both the CPU and the GPU.
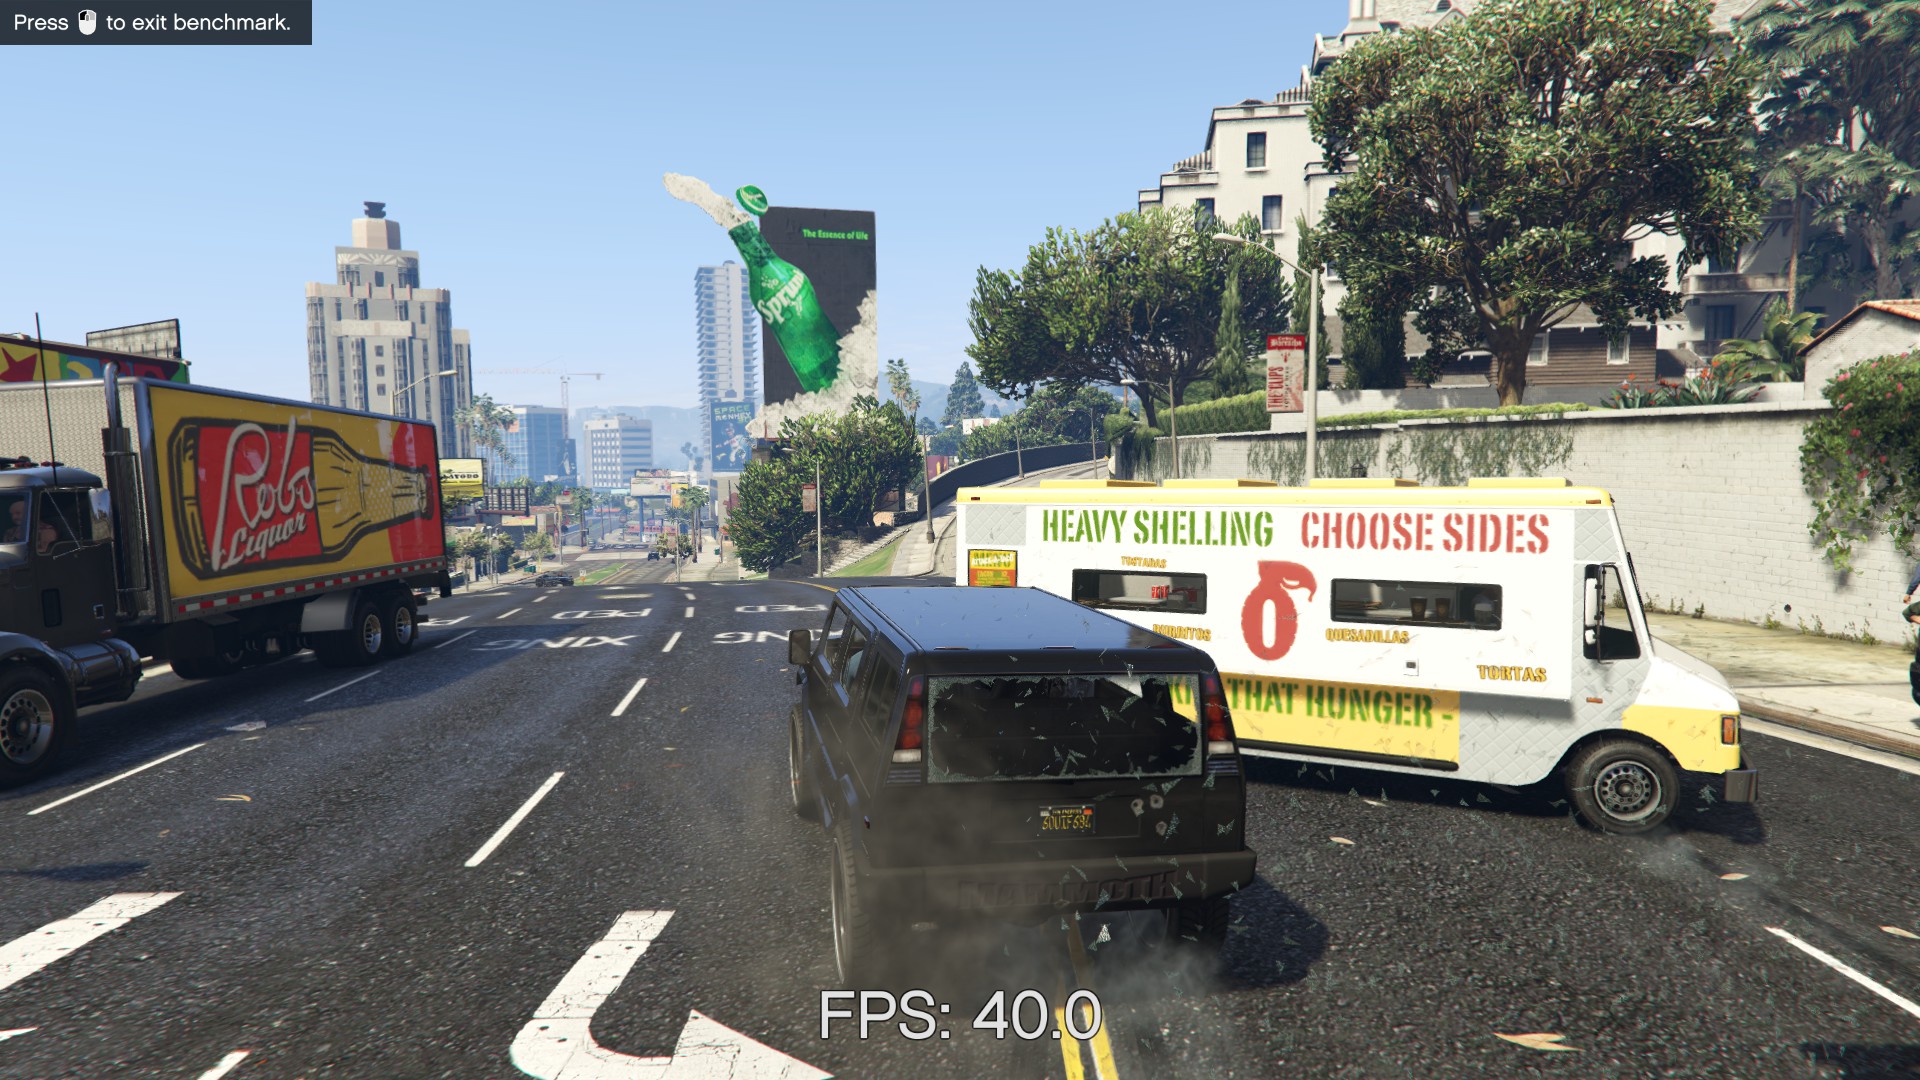
For our test we have scripted a version of the in-game benchmark. The in-game benchmark consists of five scenarios: four short panning shots with varying lighting and weather effects, and a fifth action sequence that lasts around 90 seconds. We use only the final part of the benchmark, which combines a flight scene in a jet followed by an inner city drive-by through several intersections followed by ramming a tanker that explodes, causing other cars to explode as well. This is a mix of distance rendering followed by a detailed near-rendering action sequence, and the title thankfully spits out frame time data.
There are no presets for the graphics options on GTA, allowing the user to adjust options such as population density and distance scaling on sliders, but others such as texture / shadow / shader / water quality from Low to Very High. Other options include MSAA, soft shadows, post effects, shadow resolution and extended draw distance options. There is a handy option at the top which shows how much video memory the options are expected to consume, with obvious repercussions if a user requests more video memory than is present on the card (although there’s no obvious indication if you have a low end GPU with lots of GPU memory, like an R7 (4GB).
All of our benchmark results can also be found in our benchmark engine, (Bench) .
 ******
Gaming: F1 2018
Aside from keeping up-to-date on the Formula One world, F1 2017 added HDR support, which F1 2018 has maintained; otherwise, we should see any newer versions of Codemasters’ EGO engine find its way into F1. Graphically demanding in its own right, F1 2018 keeps a useful racing-type graphics workload in our benchmarks.
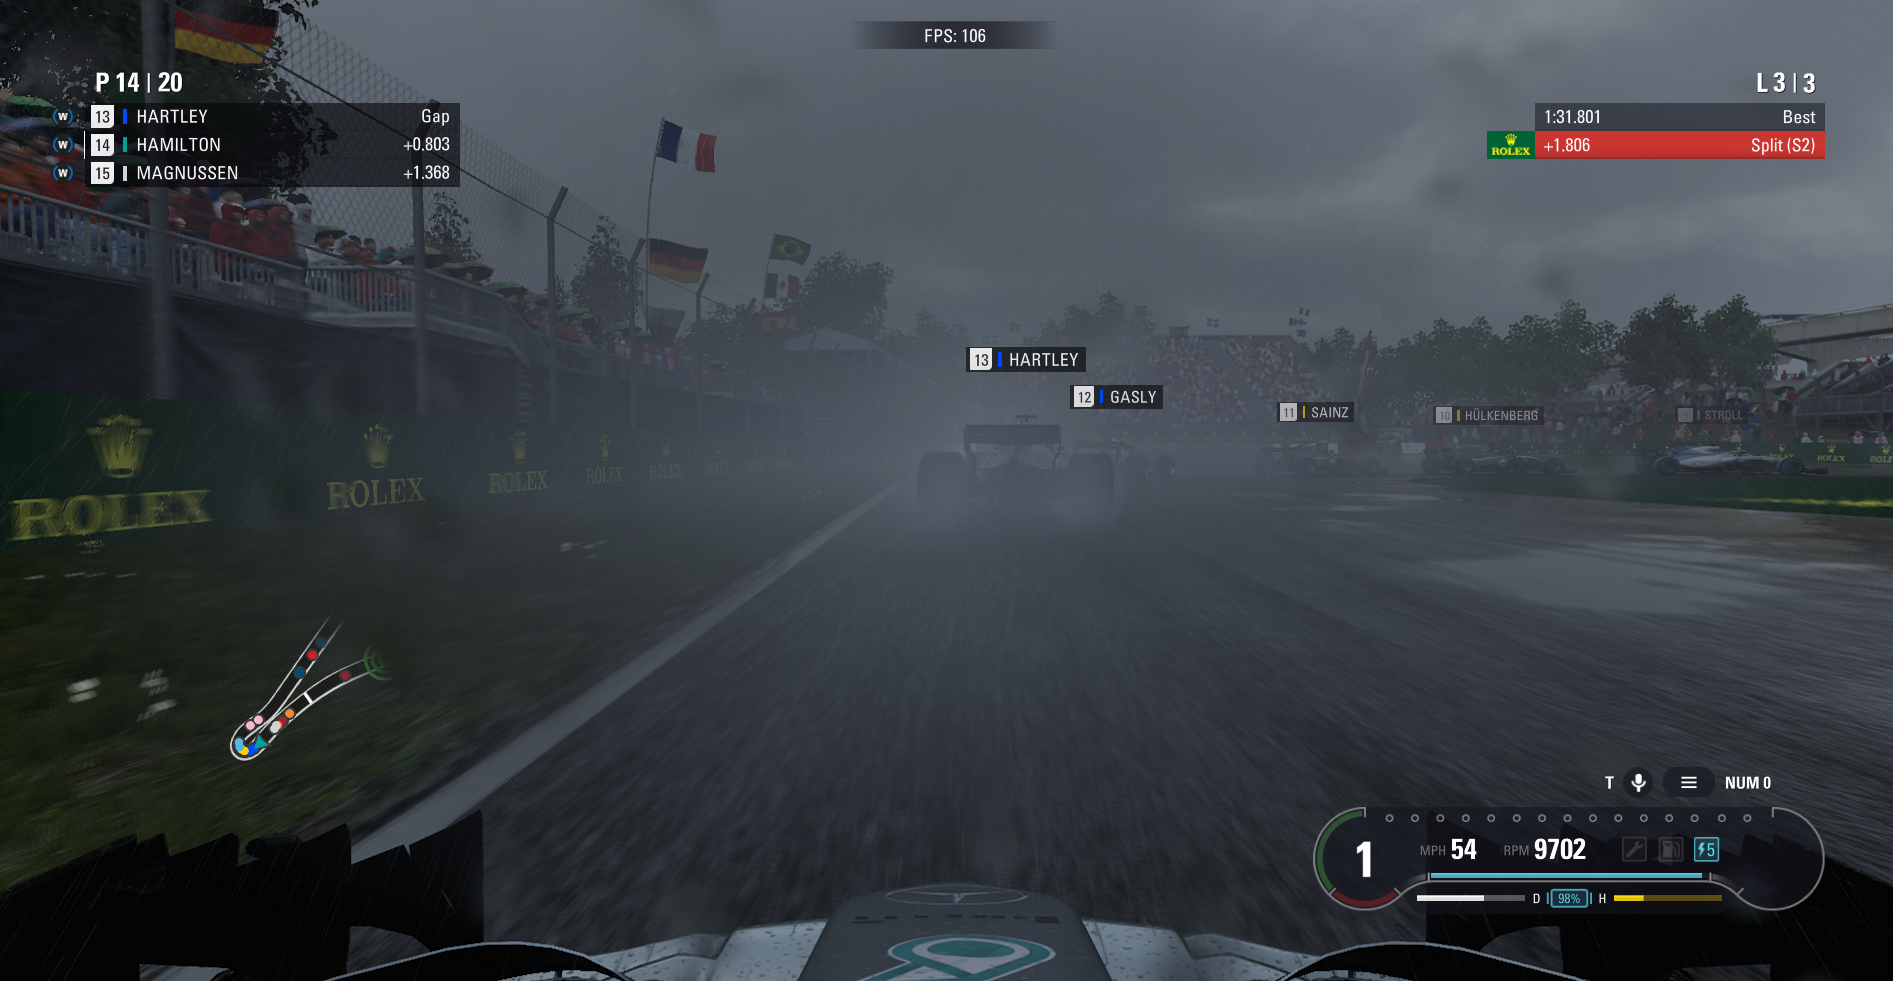
We use the in-game benchmark, set to run on the Montreal track in the wet, driving as Lewis Hamilton from last place on the grid. Data is taken over a one-lap race. ******
All of our benchmark results can also be found in our benchmark engine, (Bench) .

Conclusion: History is Written By The Victors
I have never used the word ‘bloodbath’ in a review before. It seems messy, violent, and a little bit gruesome. But when we look at the results from the new AMD Threadripper processors, it seems more than appropriate.

When collating the data together from our testing, I found it amusing that when we start comparing the high-end desktop processors, any part that was mightily impressive in the consumer space suddenly sits somewhere in the middle or back, holding its lunch money tightly. While the 16 – core Ryzen 9 3950 X and the 8-core Intel i9 – 9900 KS enjoy a lot fun in the consumer space , when Threadripper rolls up, they are decidedly outclassed in performance.
AMD has scored wins across almost all of our benchmark suite. In anything embarrassingly parallel it rules the roost by a large margin (except for our one AVX – (benchmark). Single threaded performance trails the high-frequency mainstream parts, but it is still very close. Even in memory sensitive workloads, an issue for the previous generation Threadripper parts, the new chiplet design has pushed performance to the next level. These new Threadripper processors win on core count, on high IPC, on high frequency, and on fast memory.
Is the HEDT Market Price Sensitive?
There are two areas where AMD will be questioned upon. First is the power, and why 280 W for the TDP? Truth be told, these are some of the most efficient desktop cores we have seen; it’s just that AMD has piled a lot of them into a single processor. The other question is price.
Where Intel has retreated from the $ 2000 Market, pushing its 18 – core CPU back to $ 979, AMD has leapfr ogged into that $ 1999 space with the 32 – core and $ (with the 24 – core. This is the sort of price competition we have desperately needed in this space, although I have seen some commentary that AMD’s pricing is too high. The same criticism was leveled at Intel for the past couple of generations as well.
Now the HEDT market is a tricky one to judge. As one might expect, overall sales numbers aren’t on the level of the standard consumer volumes. Still, Intel has reported that the workstation market has a potential $ 10 B a year addressable market, so it is still worth pursuing. While I have no direct quotes or data, I remember being told for several generations that Intel’s best-selling HEDT processors were always the highest core count, highest performance parts that money could buy. These users wanted off-the-shelf hardware, and were willing to pay for it – they just weren’t willing to pay for enterprise features. I was told that this didn’t necessarily follow when Intel pushed for (cores to $) , when 8 cores were $ 999, but when $ 1979 became 18 cores , a segment of the market pushed for it. Now that we can get better performance at $ 1999 with 32 cores, assuming AMD can keep stock of the hardware, it stands to reason that this market will pick up interest again.
There is the issue of the new chipset, and TRX 40 motherboards. Ultimately it is a slight negative that AMD has had to change chipsets and there’s no backwards compatibility. For that restriction though, we see an effective quadrupling of CPU-to-chipset bandwidth, and we’re going to see a wide range of motherboards with different controllers and support. There seems to be a good variation, even in the initial 12 motherboards coming to the market, with the potential for some of these companies to offer something off-the-wall and different. Motherboard pricing is likely to be high, with the most expensive initial motherboard, the GIGABYTE TRX 40 Aorus Extreme, to be $ 849. Filling it up with memory afterwards won’t be cheap, either. But this does give a wide range of variation.
One of the key messages I’ve been saying this year is that AMD wants to attack the workstation market en mass. These new Threadripper processors do just that.
The Final Word
If you had told me three years ago that AMD were going to be ruling the roost in the HEDT market with high-performance 32 – core processors on a leading-edge manufacturing node, I would have told you to lay off the heavy stuff. But here we are, and AMD isn’t done yet, teasing a 64 – core version for next year. This is a crazy time we live in, and I’m glad to be a part of it.

AMD Third Generation Ryzen Threadripper
Price no object, the new Threadripper processors are breathing new life into the high-end desktop market. AMD is going to have to work hard to top this one. Intel is going to have to have a shift its design strategy to compete.
Many thanks to Gavin Bonshor for running the benchmarks, and Andrei Frumusanu for the memory analysis.


.jpg)
GIPHY App Key not set. Please check settings