
The Arm CPU architecture has a rich history – starting with home computers in the 1980 s (as Acorn RISC Machines), then establishing itself in the 1990 s as the dominant architecture for embedded devices , a role that continues today and into the foreseeable future thanks to smartphones. Cloud infrastructure based on the Arm CPU architecture, often seen as exotic only a decade ago, has become more and more generally available in recent years.
As Arm server / instances offerings are becoming more and more ubiquitous in the public cloud, we at Kinvolk were keen to understand the drawbacks and benefits of those offerings for cloud-native applications. We assembled a set of system-level benchmark tests and added automation to execute those benchmarks aimed at gaining insight into the performance of fundamental platform features and functions. We then looked at one implementation in particular – the Ampere eMAG bare-metal servers offered by the Packet IaaS provider – to better understand how this platform compares to more traditional x 86 architecture offerings powered by Intel and AMD CPUs. The tools we created are more general though – these benchmarks can easily be run on any Kubernetes cluster; even adding support for new architectures (MIPS, POWER, IA 64, etc.) should be straightforward.
It should be noted that Kinvolk has ongoing cooperation with both Ampere Computing and Packet, and used all infrastructure used in our benchmarking free of charge. Ampere Computing furthermore sponsored the development of the control plane automation used to issue benchmark runs, and to collect resulting data points, and to produce charts.
We are releasing the automation for building container images (so the same benchmarks can be run on multiple architectures) as well as scripted automation to perform the below benchmarks to the Open Source community at:https://github.com/kinvolk/benchmark-containers
)
We had three goals going into this study:
- Provide an extendable benchmark framework that runs reproducible benchmarks and produces human-readable output (charts) for anyone to download and use.
- Identify a set of system-level tests that provide a thorough understanding of a system’s performance, provide build automation and cloud-native packaging for different CPU architectures.
- Execute the above benchmark suite on a representative set of servers for selected CPU types, and deliver a comprehensive comparison which also discusses cost of operation.
We selected similar Ampere, AMD, and Intel servers as offered by Packet.
We benchmarked the performance of
- Ampere Computing’s eMAG CPU, (cores @ 3GHz) w / 3.3 GHz TURBO )
- AMD’s EPYC 7401 P, w / (cores /) threads @ 2.2 GHz (w / 2.8 GHz TURBO)
- Intel’s XEON 5120 x2, w / (cores /) ************************************************************************************************************************************************** (threads @ 2.2GHz) w / 3.2 GHz TURBO)
The server configuration details can be found onPacket’s websiteand will be summarized here again.
| Ampere eMAG | AMD EPYC | Intel XEON | |
| Packet Server Type | c2.large.arm | c2.medium.x 86 | m2.xlarge.x 86 |
| Cost per Hour |
1 $
|
1 $
|
2 $
|
| SKU |
Lenovo ThinkSystem HR (A) |
Dell PowerEdge r 6415
|
Dell PowerEdge R 640
|
| Sockets |
1
|
1
|
2
|
| Cores |
32
|
24
|
28
|
| CPU threads |
32
|
48
|
52
|
| Hyperthreading |
no
|
yes
|
yes
|
| Clock Speed |
3-3.3 GHz
|
2.2-2.8 GHz (max 3 GHz single core)
|
2.2-3.2 GHz
|
| RAM |
128 GB DDR4
|
64 GB DDR4 ECC RAM
|
384 GB DDR4 ECC RAM
|
| Storage |
480 GB SSD
|
2 x GB SSD 2 x (GB SSD) |
2 x GB SSD 3.8 TB NVMe
|
| 10 G NIC |
Mellanox Technologies MT 27710 Family [ConnectX-4 Lx] |
||
| OS |
Flatcar Container Linux Alpha, v 2234 Kernel 4. 19 Docker 18. 06 Kubernetes 1. 15 .3
|
Flatcar Container Linux Stable, v 2079 and v 2247 Kernel 4. 19 Docker 18. 06 Kubernetes 1. 15 .3
|
Flatcar Container Linux Stable, v 2247 Kernel 4. 19 Docker 18. 06 Kubernetes 1. 15 .3
|
| Container Build Tooling |
Alpine Linux 3. 10 GCC 8.3 Musl Libc 1.1. 22
|
||
The systems have comparable hardware generations but do not have the same socket, CPU thread, and core count nor have the same clock speed. There are even bigger differences in terms of how many circles instructions need and of course the big architectural difference between Arm and x 86 which will be covered in the next section.
The amount of RAM, and type of SSDs and NVMes will not play a role in our benchmarks but may have been factored into the price difference.
Ampere’s eMAG system is a bit smaller than the others which may incur a disadvantage in some benchmarks. It also has not been optimized for floating point and vector operations but we will also benchmark them.
Still we think that the comparison of these three systems is valid because it allows to focus on the architectural differences and the different pricing.
Hardware Security
The benchmarks are run with all hardware side-channel mitigations enabled (as in Linux 4. 19) to address vulnerabilities such as Specter and Meltdown. However, Intel’s XEON uses Hyperthreading (SMT) and unless Hyperthreading is turned off a whole class of side-channel vulnerabilities stays present such as L1TF (Foreshadow) and MDS (Zombieload). AMD’s SMT architecture separates the CPU threads on a core more than Intel does and is therefore not affected by many of these side-channel vulnerabilities (You can check this on your systems by runningspecter-meltdown-checkerand look for reports that mention “SMT vulnerable”). The recommendation for Intel is to turn off Hyperthreading when running untrusted code on the server.OpenBSD disabled SMT / Hyperthreading on all systemseven by default since the ongoing and future research may affect AMD, too. We therefore will include benchmark results that do not utilize all CPU threads but only all cores. The additional benefit besides performance numbers with security in mind is that we can see if there is any benefit of Hyperthreading for a particular workload.
Before we dive into discussing specific system / cluster metrics we’re interested in and the tools to deliver those metrics, let’s address the elephant in the room: When coming from an x 86 world, going Arm implies supporting a significantly different CPU architecture. It’s not just the mnemonics that are all different – also, Arm CPU instructions use a 3-address (or 3-register) instruction set (mul r0, r1, r2 multiplies the values of R1 with R2, and stores the result in R0) , while x 86 is limited to 2 addresses (imul eax, ebx multiplies EAX by EBX, and stores the result in EAX). The way instructions and data are structured in memory is fundamentally different, too – Arm follows a Harvard architecture approach, where instructions and data are stored in separate memory “words”. X 86 on the other hand implements a von Neumann architecture, mixing data and instructions at least at the macro-code level (the existence of separate L1 “data” and “instruction” caches hints at Intel using Harward architecture at the microcode level, and stores micro-ops in L1 caches
However, having spent significant time with cloud-native applications on both x 86 and Arm – including working with our Flatcar Container Linux OS and Lokomotive Kubernetes distribution on both, not least during the course of developing our benchmarking automation for this report – demonstrated to us that on the cloud-native level, those differences disappear, abstracted away by Kubernetes’ runtime and container images for each architecture. In our experience, both technological effort and implicit business risk of creating or packaging cloud-native apps for either Arm or x 86 had no significant difference.
In summary, and factoring in our experience of operating cloud-native workloads on both CPU architectures, we feel that Arm has become a commodity, even though it’s sometimes not yet treated as such by developers and operators. Whether a specific cloud-native application runs on nodes that happen to be powered by an Arm CPU, nodes that are driven by x 86, or a hybrid mix of those, is not a significant factor because of the level of abstraction provided. During our explorations we also looked at legacy (monolithic) applications being ported into a cloud native environment, and found that a similar pattern applies: new microservice infrastructure carefully added during the work of porting legacy apps to cloud-native environments simply do away with old paradigms of depending on a single CPU architecture, and cluster runtime abstraction makes previous differences disappear.
In order to understand performance differences when running cloud-native applications on Arm, AMD, and Intel CPUs, we considered a range of metrics of system-level functions which provide the foundation of the runtime environment cloud-native applications perform in. We started with considering basic hardware properties like raw CPU calculation performance and memory I / O, network performance, to provide an overview of what to expect and where to take a closer look. We extended our investigations into more complex OS performance characteristics, like threading, scheduling, and lock performance, which make up the most fundamental runtime infrastructure for both the Kubernetes control plane as well as cloud-native workloads. Ultimately, and following observations made during lower level benchmarks, we focused on a number of cloud-native components that are used in the majority of cloud-native architectures – HTTP server and object store in particular.
Specifically, we use the following benchmark tools to get hardware performance metrics:
- (stress-ng) and
sysbenchfor CPU and memory I / O workloads iperf3for network performance
For generating OS-level metrics, we used:
- (stress-ng) for shared memory, locks, and threading performance
sysbenchfor the OS ‘virtual filesystem (VFS) layer performance
In addition to the above hardware- and system-level benchmarks, we used the following cloud- native applications (which are modules with widespread use in existing cluster deployments):
memcachedas a multi-threaded key-value storeredisas a single-threaded key-value store (launched with multiple, independent instances to saturate a whole node’s CPUs)nginxas a HTTP server
We used Redis’ excellentmemtier_benchmarktool for generating metrics on both key-value stores;ab,fortio, andwrk2(which we have past experience with, from our service mesh benchmarking) are used to benchmark NGINX.
The build automation for the tools discussed above is available as open source / free software from ourGithub repo, allowing for straightforward reproduction of the container images we used for benchmarking but you can also get the builtimages on quay.io.
NOTEthat the benchmark container images are based onAlpine Linux, which uses themuslC library instead ofglibc. This allows us to rigorously optimize for size and speed. All code is compiled with GCC 8.3.0.
Kubernetes Stack, Reproducibility and Extendability
We provisioned the Kubernetes clusters that we used to run our benchmarks on with our Lokomotive Kubernetes distribution, and used Flatcar Container Linux as its underlying operating system. Both are fully open source and available to everybody to reproduce our benchmarks, and to extend our work by running their own.
Instructions for the (largely automated) provisioning of test clusters are provided in our benchmark containers repository, as is our scripted automation for running the benchmarks. This also allows others to improve and to extend on our work.
NOTE:The default QoS class for jobs in Kubernetes isBestEffort. The defaultCPU shares settingforBestEffortis too limiting to utilize the full hardware because the value is 2 instead of the default 1024. Therefore, we set the (CPU requestof the benchmark pods to 1 which results in the QoS classBurstablethat has 1024 as CPU share value.
Basic setup
We benchmarked three server types. For each server type we provisioned a cluster where this server type is the worker node to run the benchmark pods.
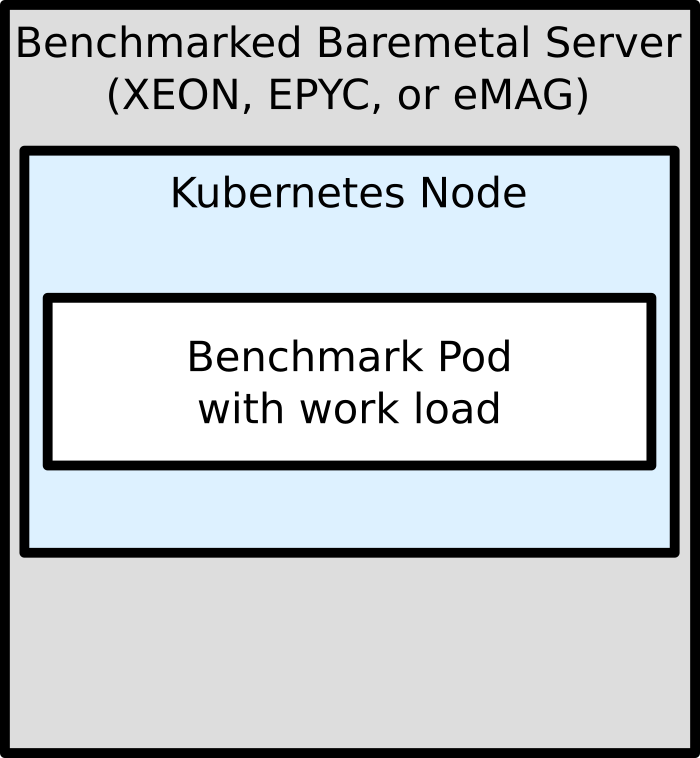
Networking setup
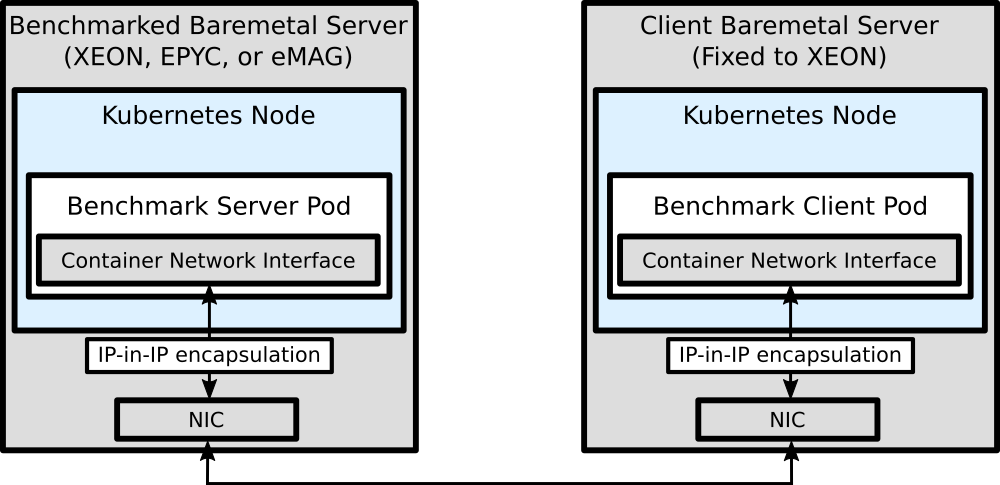
We use Calico as Kubernetes network plugin. Calico gives each Pod, i.e., our benchmark container, a virtual IP from a IP-in-IP overlay network. Since this IP-in-IP encapsulation introduces an overhead our cloud-native benchmark diverges from a hardware-oriented benchmark because instead of measuring node-to-node network performance we look at pod-to-pod network performance.
For network benchmarks a second worker node is needed. We decided to measure the network performance as observed from a fixed client system. The final benchmark architecture for network performance can be seen in the following diagram.
Multiple Data Points and Statistical Robustness
As we are using the datacenters of a public cloud provider – Packet – to run our benchmarks, we have no control over which specific servers are picked for individual provisionings. The age of the machine and its respective components (memory, CPU, etc), and for network testing, its position in the datacenter relative to the other cluster nodes (same rack? Same room? Same fire zone?), And the state of the physical connections b etween the nodes all have an impact on the raw data any individual test run would produce. The activity of other servers that are completely unrelated to our test, but present in the same datacenter, and sharing the same physical network resources, might have a derogatory effect onIPERFandnginxin particular, leading to dirty benchmark data.
To counter, we apply sufficient statistical spread with multiple samples per data point to eliminate volatile effects of outside operations as well as aging / wear effects of hardware that make up our test nodes. We furthermore use multiple clusters in different datacenters with implicitly different placement layouts to also help drawing absolute conclusions from our data.
In order to achieve sufficient statistical spread we execute individual benchmark runs multiple times to derive average, minima, and maxima. Using multiple clusters of identical setup also ensures our capacity does not include a “lemon” server (degraded hardware) or a bad switch, and to detect outliers like nodes placed at remote corners in the datacenter impacting network tests.
Overall we ran benchmark tests in 2 regions in parallel, repeating each benchmark in 15 iterations. For each of the CPUs in each chart presented, we calculated the mean of the data points, and provided min-max bars to display the variance.
In this section, we discuss the results achieved by Ampere’s eMAG, AMD’s EPYC, and Intel’s XEON. Apart from looking at raw benchmark results, we also consider cost of operation – in this case cost of benchmarking – based on the hourly rates offered by Packet. This implies the assumption of Packet pricing server types at rates that reflect their cost of acquisition and operation:
- Ampere’s eMAG is priced at 1 $ / h; cost-operation values will have a scaling factor of 1
- AMD’s EPYC is also priced at 1 $ / h; cost-operation values will have a scaling factor of 1
- Intel’s XEON is priced at 2 $ / h; cost-operation values will have a scaling factor of 0.5
All benchmarks run in 3 configurations:
- Multi-threaded with thread count equal to the number of CPU threads in the system. For Ampere Computing’s eMAG this does not change anything as the CPU does not implement hyperthreading.
- Multi-threaded with thread count equal to the number of physical cores in the system. This is a good reference point for x 86 systems required to turn off hyperthreading to protect against Specter-class hardware vulnerabilities such as MDS and L1TF.
- Single-threaded, to benchmark the performance of a single physical core
The result charts are laid out accordingly:
| Raw Performance | Performance per $ |
| [ Chart for hyperthreads performance ] | [ hyperthreads performance per dollar ] |
| [ Chart for physical cores performance ] | [ physical cores performance per dollar ] |
| [ Chart for single core performance ] | [ single threaded performance per dollar ] |
The big bars show the mean of the results, the small overlay bars show the distance to minima and maxima of the results.
Hardware-level Benchmarks
CPU speed and Memory I / O rates
We use the following tests for stressing CPUs and Memory I / O:
sysbench
- (memory) (multi-thread memory writes, raw throughput rates in MB / s)
CPU(float-heavy prime number generation)
stress-ng
vecmath(128 bit integer vector math operations w / 8, 16, 32, and 64 bit vector values)matrix(floating point matrix operations – add, sub, mul, div, dot product, etc.)memcpy, which also stresses caches (copy 2MB of memory, then mem- move with 3 different alignments)
Disclaimer:As noted after the presentation of the three system specifications, Ampere’s eMAG is not optimized for floating point and vector operations. As these are anyway present in many different workloads we think it’s beneficial to measure the current performance even if future versions of the hardware may perform better.
Setup
The benchmark pods run on the Kubernetes worker node with a run length of 30 seconds and multiple iterations directly after each other. Here are the effective command lines for the linked container images; the threads count is varied from number of CPU threads, to number of cores to a single thread:
sysbench--threads=$ PARAMETER --time=30 memory --memory-total-size=(G run) (sysbench) --threads=$ PARAMETER --time=30 CPU Run
stress-ng- (vecmath | matrix | memcpy) --threads=$ PARAMETER --timeout 30 s --metrics-brief
Summary
Memory-heavy workloads– multi-threaded applications that change large amounts of RAM in brief amounts of time, like in- memory databases and key-value stores, run extremely well on Ampere’s eMAG. Both AMD’s EPYC and Intel’s XEON run into memory bus contention issues when many threads / processes try to access memory at the same time. eMAG displays impressive vertical scalability with many-threaded memory I / O, allowing for running a high number of processes (for instance, pods) without impacting individual memory data rates.
For somecompute-intensive benchmarks– mainly integer and floating point micro-benchmarks of the stress-ng suite – we found AMD’s EPYC in the lead, both with raw performance as well as with cost-performance ratio. Ampere’s eMAG matches or exceeds EPYC performance in the more generic cpu benchmark of the sysbench suite, and generally offers a good cost / performance ratio over Intel’s XEON.
sysbench memory
In multi-thread benchmarks of raw memory I / O we found a clear performance leader in Ampere’s eMAG, outperforming both AMD’s EPYC and Intel’s XEON CPUs by a factor of 6 or higher. We believe that many-thread memory I / O leads to a high amount of memory bus contention on both Intel and AMD, while Arm has an architectural advantage over both x 86 s.
sysbench cpu
In the floating-point heavy CPU benchmark, Ampere’s eMAG leads the field both in raw performance and regarding cost-per-operation when multiple threads are involved, with AMD’s EPYC in a close lead regarding raw single-thread performance. There is no noticeable performance gain from EPYC’s hyperthreading, suggesting that this benchmark utilizes CPU resources that cannot be shared between the siblings of a hyperthread. The varying minimum and maximum performance when the thread count equals the CPU thread count for AMD and Intel comes from the scheduling differences when two hyperthreads access the same core resources.
stress-ng Vecmath
In the integer vector operations micro-benchmark, AMD’s EPYC and Intel’s XEON lead the race performance wise and while AMD leads with cost-per-cycle. Ampere’s eMAG offers a similar performance-per dollar ratio as Intel’s XEON.
stress- ng matrix
Similar to integer performance above, AMD’s EPYC and Intel’s XEON lead in stress-ng’s matrix floating point operations performance wise but with a better cost-per-cycle ratio for AMD. Ampere’s eMAG offers a on-par performance-per dollar ratio to Intel’s XEON. The strong variance of minimal and maximal XEON performance comes from scheduling differences when resources of a core are accessed that cannot be shared by hyperthreads.
stress -ng memcpy
In the memcopy benchmark, which is designed to stress both memory I / O as well as caches, Intel’s XEON shows the highest raw performance, and AMD’s EPYC comes in last. Ampere’s eMAG leads the field – with a small margin over Intel’s XEON – when cost is factored in. We suspect alignment issues to be the main cause of the Ampere eMAG’s lower performance in this benchmark when compared to sysbench’s memory I / O benchmark above.
Network Performance
We useiperf3to run single- and multi-connection network performance tests. The program follows the select server design where a single thread handles all connection syscalls. The Linux kernel network stack still takes advantage of multiple CPUs.
Network testing used an Intel XEON node as the networking peer (client) in any cluster, so the IPerf benchmark below was performed between XEON↔XEON, EPYC↔XEON, and eMAG↔XEON. We used a XEON client because of the generally satisfying network performance of this platform.
The client receives data over TCP from the benchmarked nodes which run the iperf3 server. Since we run on Kubernetes, this means a pod-to-pod connection over Calico’s IP-in-IP overlay network. The iperf3 client was started with 56 TCP connection in all cases (the number of CPU threads on the fixed XEON client).
Because we cannot control the number of kernel threads of the network stack that the iperf server will use, we turned Hyperthreading off instead of simulating it by fixing the thread count to the number of cores as before. This was done by running this on the node:
sudo sh -c 'echo off>/ sys / devices / system / cpu / smt / control'Setup
The benchmark has a run length of 30 seconds and multiple iterations directly after each other.
The effective command line for the linked containers is as follows; the parameter sets the connection count to 56 or 1:
Benchmarked worker node with server pod:iperf3-s
Fixed XEON worker node with client pod:iperf3-P $ PARAMETER -R -c $ POD_IP --time 30
Discussion
AMD’s EPYC excels in raw network performance and therefore in cost / performance, too. Ampere’s eMAG offers lower throughput jitter, and a better cost / performance ratio, than Intel’s XEON.
NOTEagain that this here is pod-to-pod traffic. Node-to-node traffic has no problems in saturating the 10 G line-rate on all systems. The testing here highlighted that some areas need to be optimized for better network performance on Kubernetes with Calico’s IP-in-IP overlay network.
We did not test a node-to-node setup with 100 G NICs butresults collected in other environmentsshow that Ampere’s eMAG is capable of saturating a (G line-rate) as are the other systems).
Based on the findings here, we expect software optimizations to come that will improve the eMAG performance.
Operating System level Benchmarks
We use the following tests to benchmark basic runtime and operating system features:
sysbench
- (fileio) on a tmpfs in-memory filesystem (I / O to 128 files in parallel, stresses OS kernel)
stress-ng
- (spawn) ,
sem(POSIX process creation, semaphore operations; stresses OS kernel) shm(8MB shared memory creation / destruction; stresses OS kernel and memory)crypt,hsearch,tsearch,lsearch,bsearch,qsort(C library functions)atomic(compiler-intrinsic atomic memory operations)
(Setup)
The benchmark pods run on the Kubernetes worker node with a run length of 30 seconds and multiple iterations directly after each other. Here are the effective command lines for the linked container images; the threads count is varied from number of CPU threads, to number of cores to a single thread:
sysbenchfileio --file-test-mode=rndwr prepare(ran before the benchmark on a tmpfs in-memory filesystem)sysbench--threads=$ PARAMETER --time=30 fileio --file-test-mode=rndwr run(done on the tmpfs in-memory filesystem)stress-ng- (spawn | sem | shm | crypt | hsearch | tsearch | lsearch | bsearch | qsort | atomic) --threads=$ PARAMETER --timeout (s --metrics-brief
Summary
Ampere’s eMAG displays a significant advantage in memory-heavy and Operating System related tasks that do not require locking. Locking operations push eMAG to the third position wrt. raw performance, and to the second when cost is factored in.
AMD’s EPYC takes the lead when synchronization and locking is a factor, both in terms of raw performance as well as for performance / cost.
Intel’s XEON delivers a better performance than AMD’s EPYC in non-locking OS related tasks, but falls back to the third position if cost is factored in.
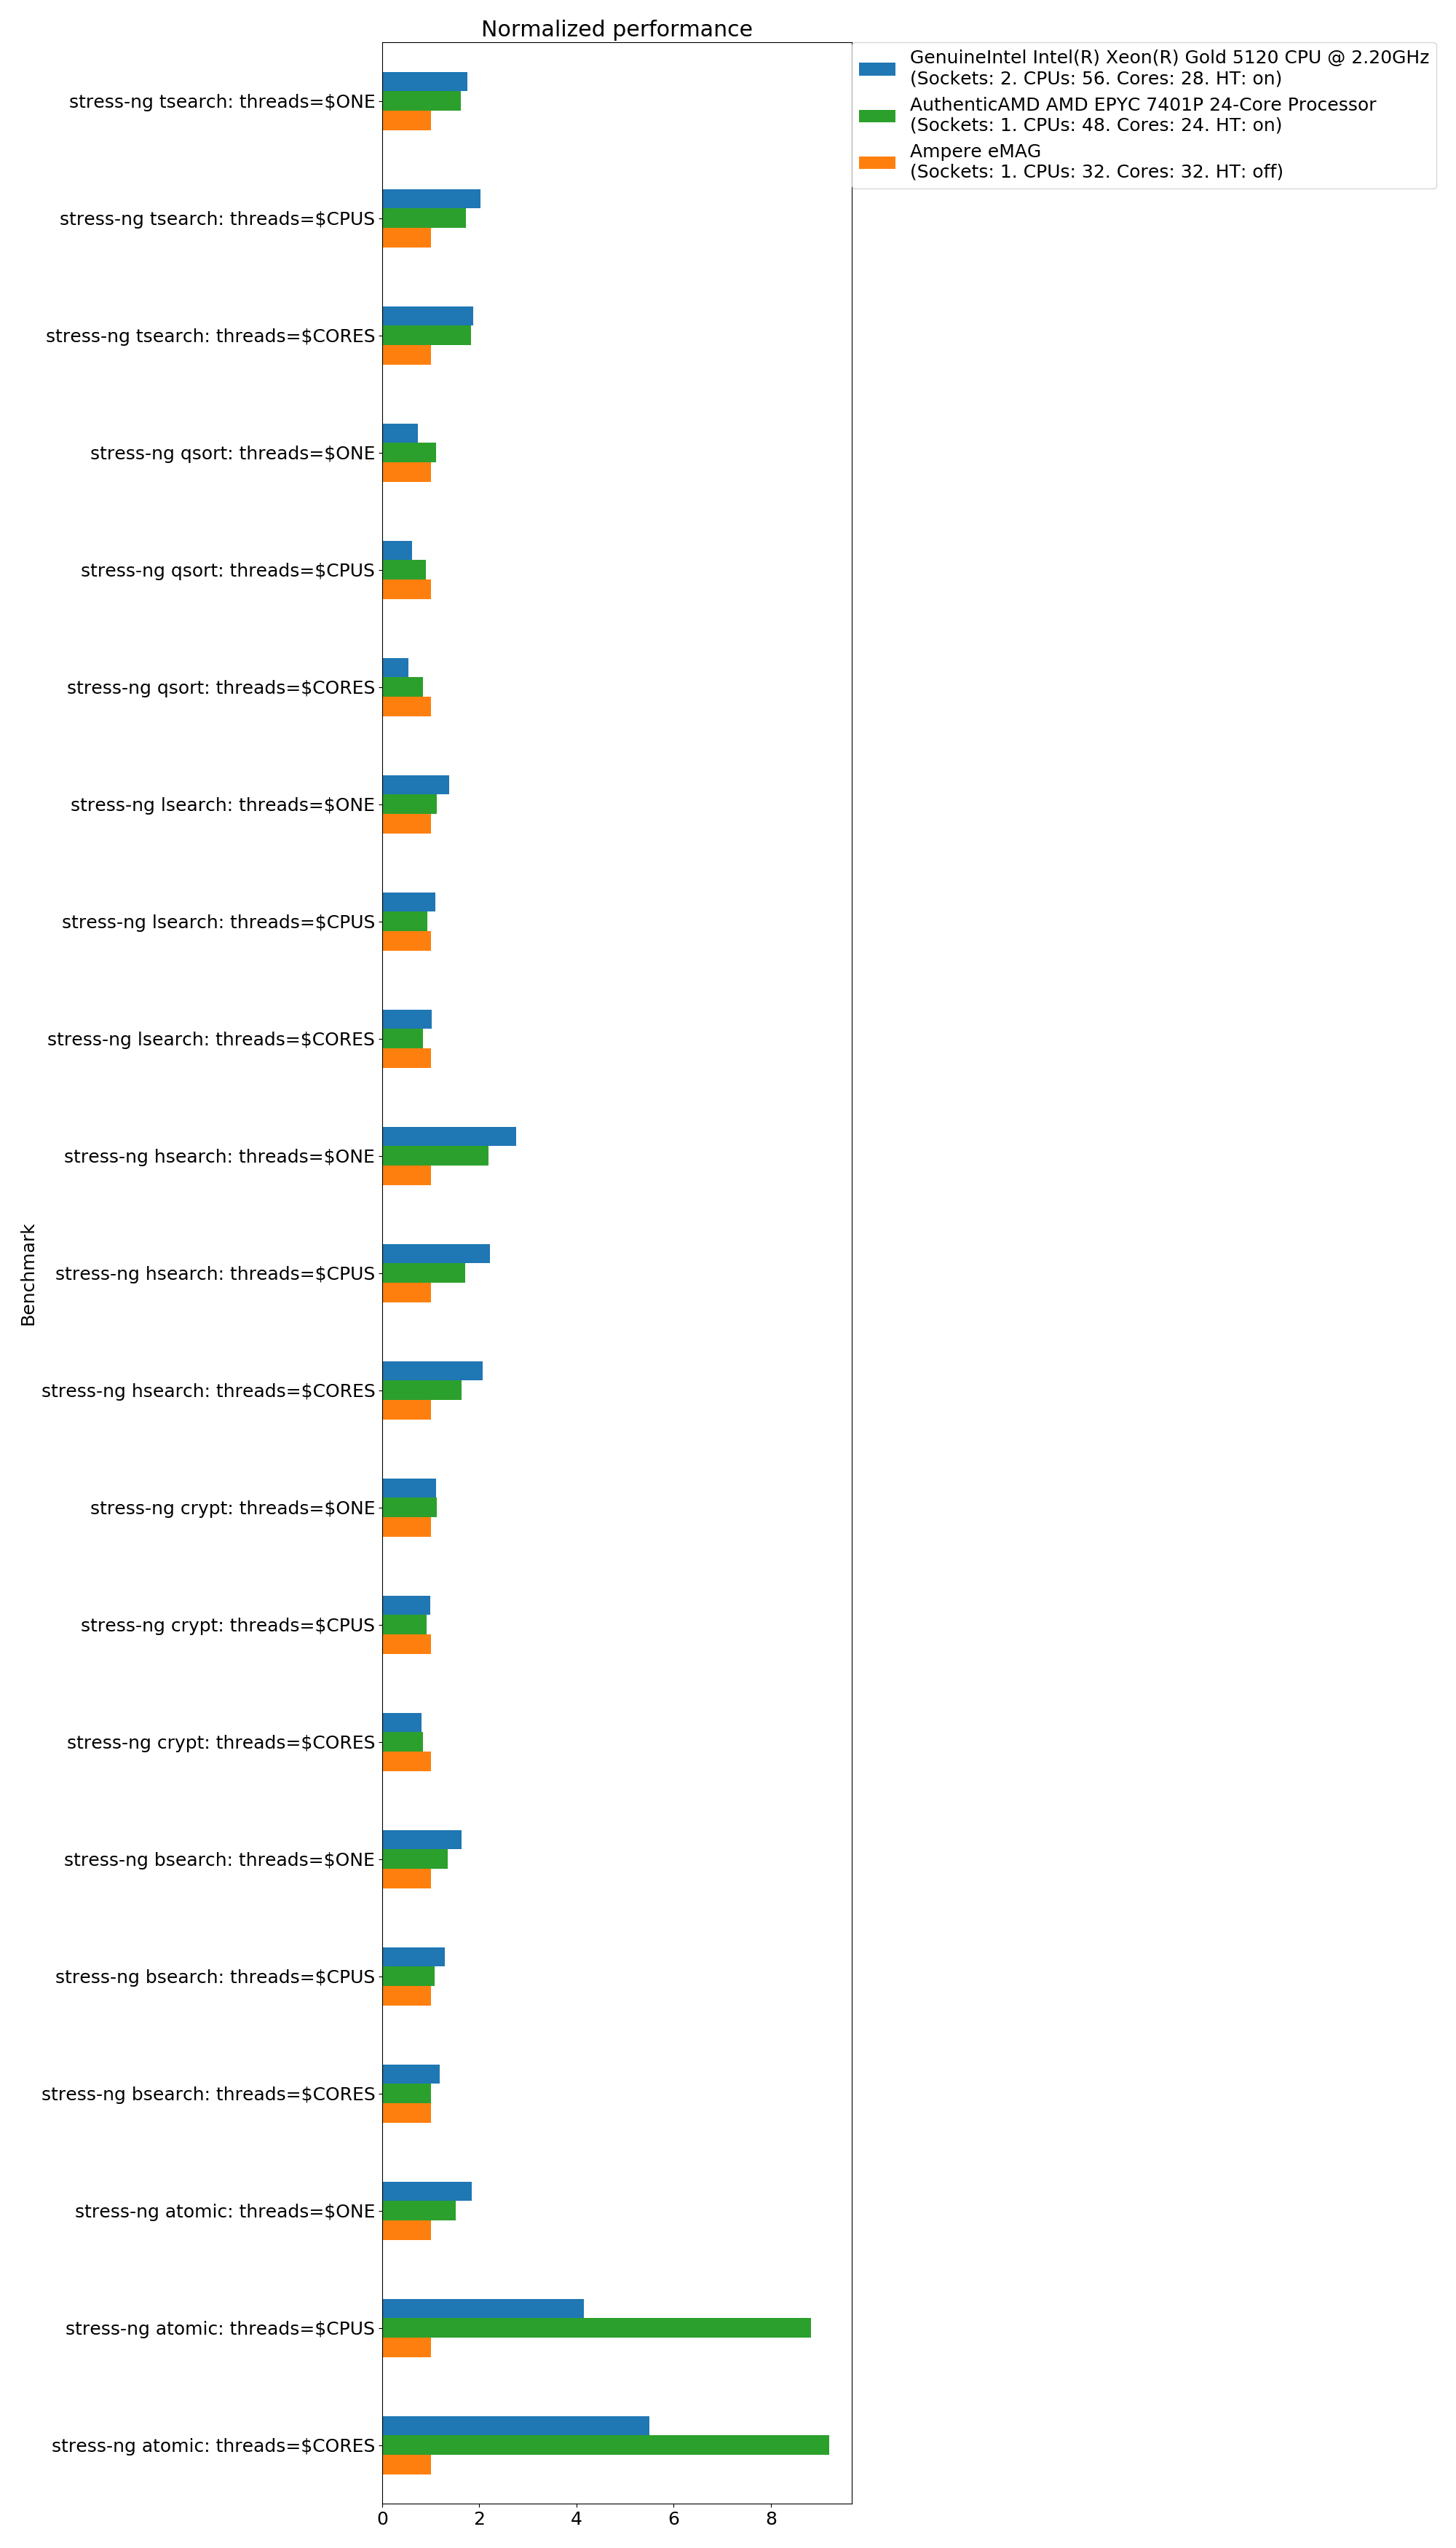
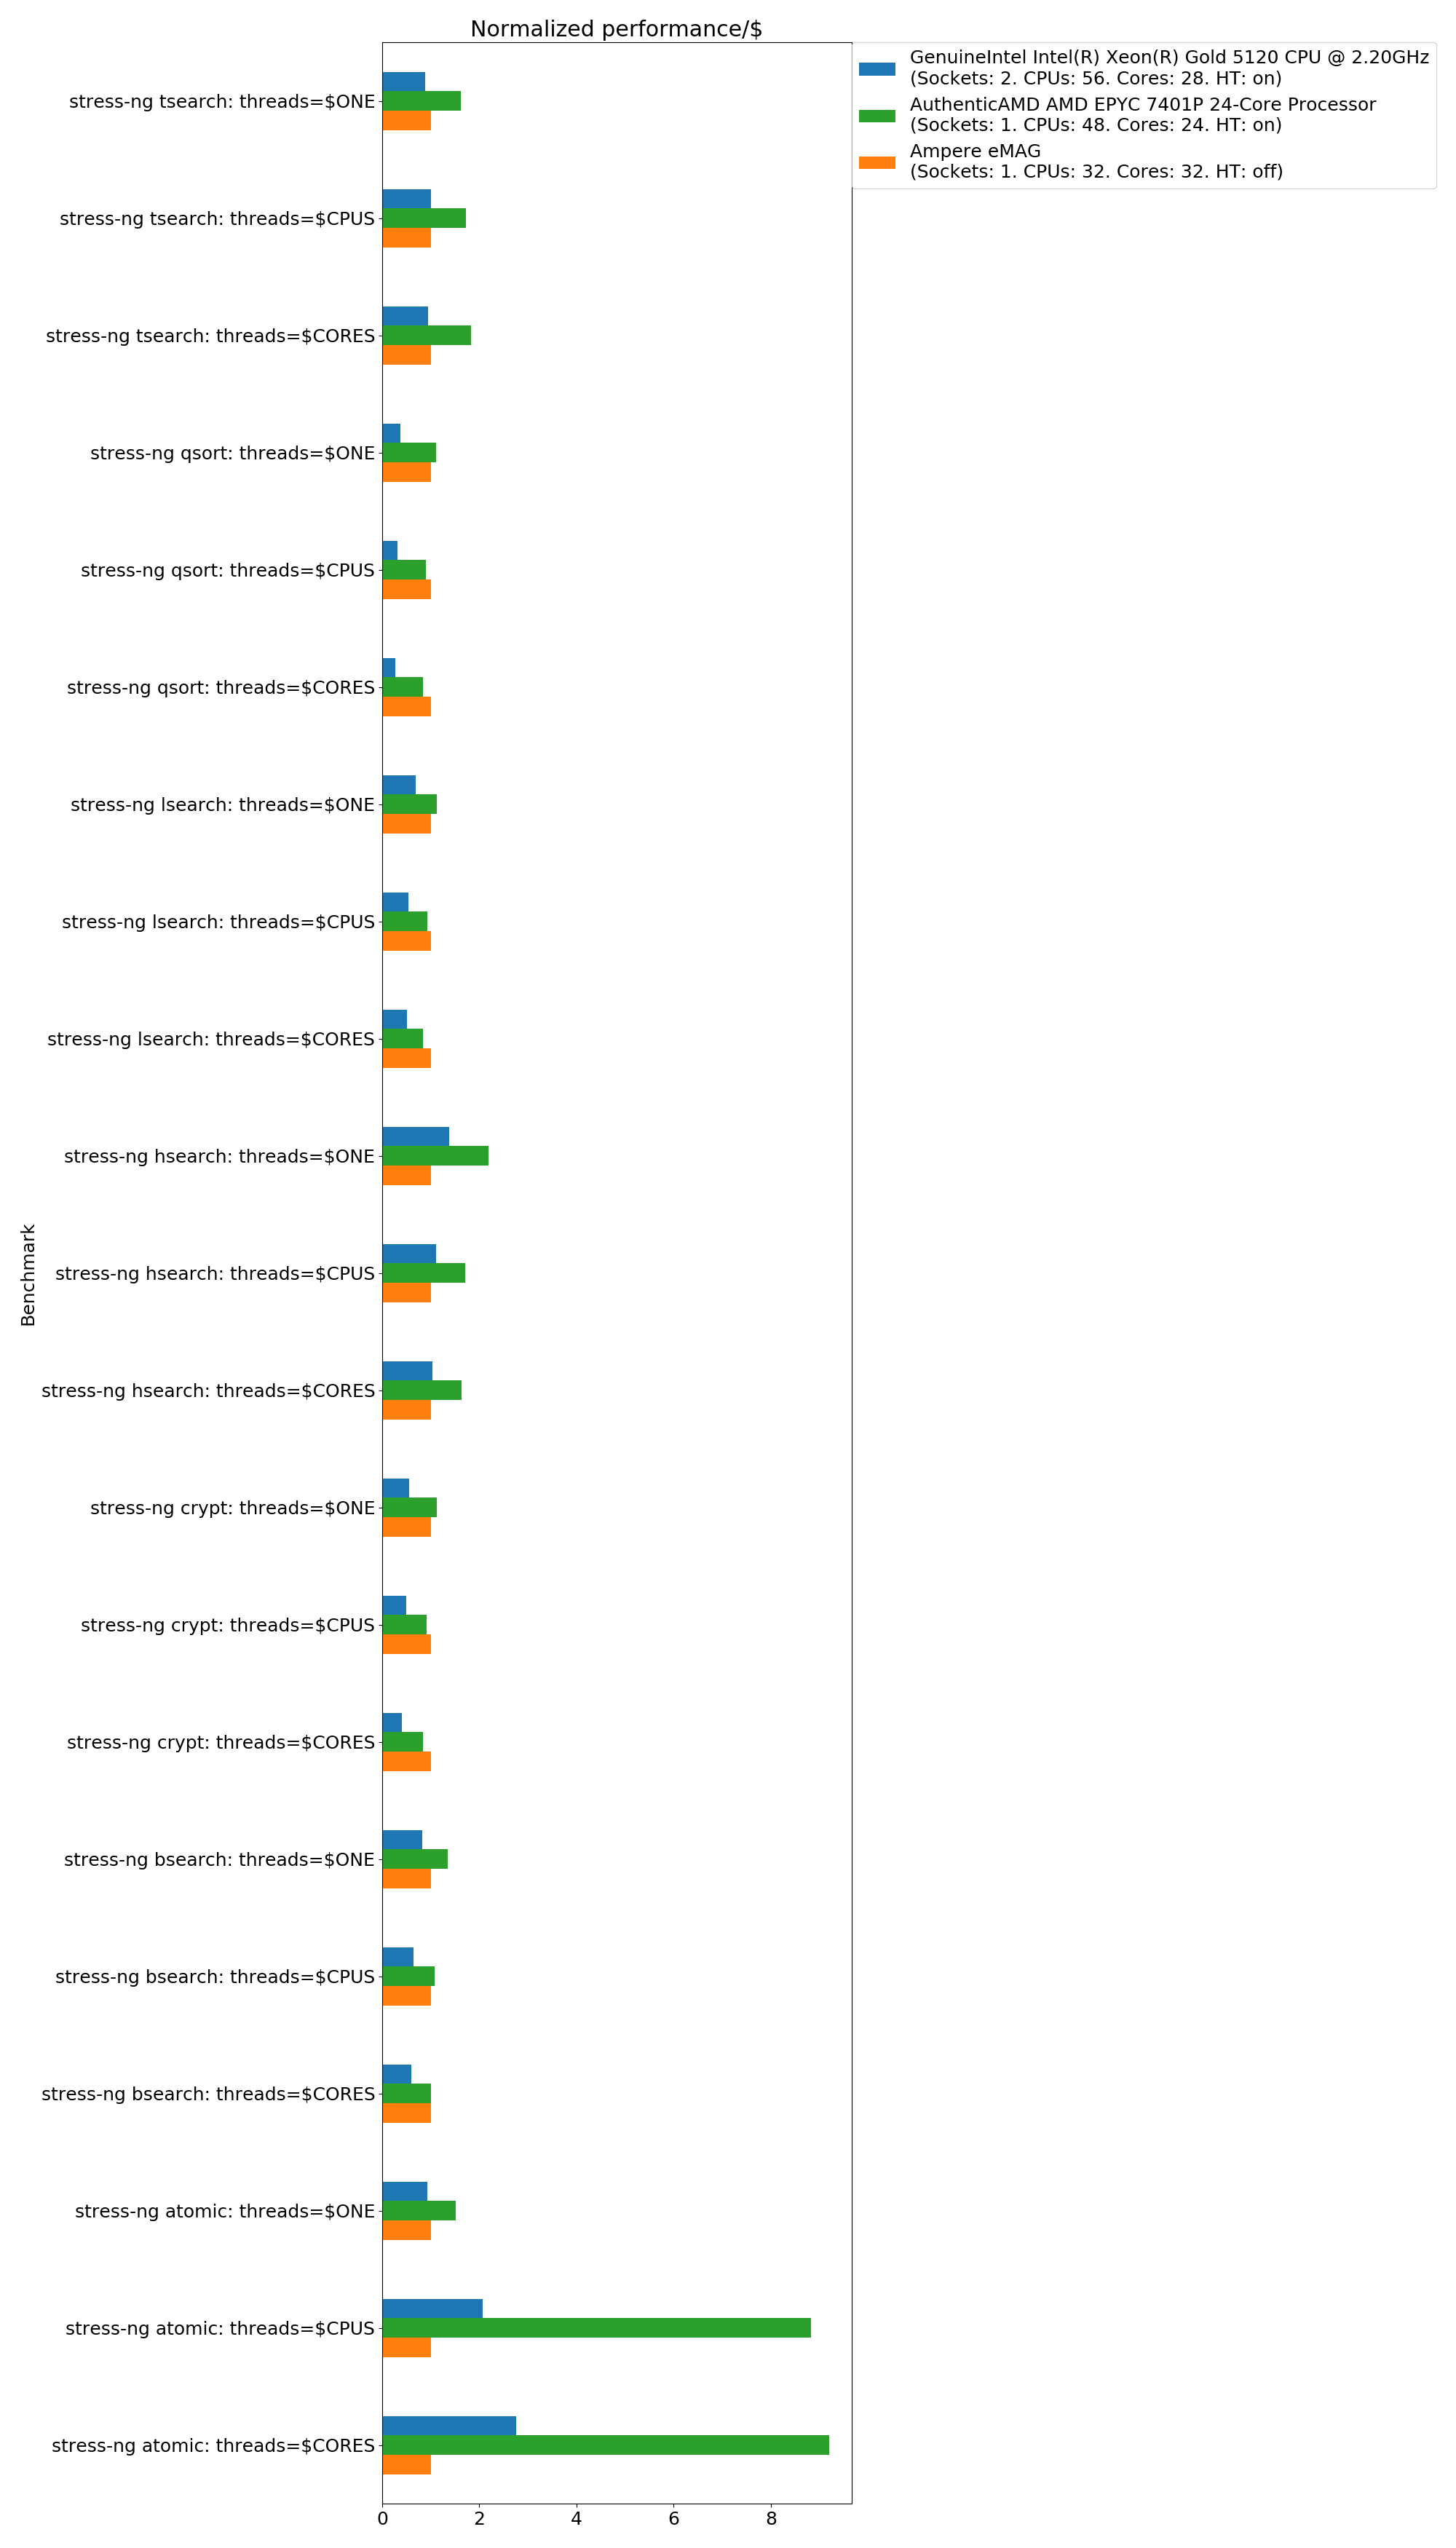
System library related tasks are performed best on eMAG when throughput is a factor – eMAG takes a solid lead in the qsort and crypt micro-benchmarks. Intel’s XEON delivers the best performance for search and lookup primitives, with AMD taking the lead when cost is a factor. AMD’s EPYC is, by some margin, the fastest with atomic memory operations, with Intel’s XEON coming in second, and Ampere’s eMAG in a distant third position.
sysbench fileioon a tmpfs in -memory filesystem
The setup uses a KubernetesemptyDir Volume backed by the Memory mediumwhich results in a tmpfs mount.
Ampere’s eMAG excels at raw file system performance on a tmpfs – writing small amounts of data to many files, with XEON coming in as a close second. The eMAG’s lead over Intel’s XEON increases when cost is factored in, and AMD’s EPYC moves up to the second position.
stress-ng spawn
The spawn micro-benchmark exercises process generation (using the POSIXspawnAPI) and process deletion, a basic functionality of operating systems. Ampere’s eMAG leads in the results, with Intel’s XEON being a close second in terms of raw performance. With cost factored in, XEON falls back to the last position, and AMD’s EPYC takes the second position.
stress-ng sem
This micro-benchmark gauges semaphore performance, acquiring and releasing semaphores in rapid succession. Ampere’s eMAG leads in performance (operations per second) regarding physical cores, but AMD’s EPYC and Intel’s XEON really benefit from hyperthreading, pushing eMAG to the last position if you can afford the trust of turning on HT. When cost is factored in, AMD’s EPYC leads with a large margin, and eMAG and XEON come in second and third, respectively.
(stress-ng shm)
The shared memory micro-benchmark creates and destroys multiple shared memory objects per thread, using the POSIX API. Just as with the memory I / O hardware benchmark above, we see eMAG leaving both XEON and EPYC way behind, by a factor. Intel’s XEON comes in second in terms of raw performance, and AMD’s EPYC takes the second position when cost is factored in.
stress-ng crypt, hsearch, tsearch, lsearch, bsearch, qsort, atomic
The graph below covers a number of stress-ng micro-benchmarks that concern the performance of both standard library and compiler.atomictests the* __ atomic __compiler intrinsics,cryptexecutes hashing algorithms (MD5, SHA – 256, SHA – 512), and the* searchtests andqsortperform various lookup and sort functions on 32 bit integer values.
The results are normalized to Ampere eMAG having the value 1.0 for each benchmark.
Normalized performance:
Normalized performance per $:
Cloud-Native Application Benchmarks
We ran benchmarks for memcached, Redis, and nginx to get a better understanding of the overall performance when executing complex cloud-native workloads.
Memcached and Redis
memtier_benchmark, a high-performance key-value store benchmark from redis.
(NGINX)
ab(ApacheBenchmark) to measure max number of HTTP req / secwrk2to measure tail latency performance as maximal latency that 99. 9% of the HTTP requests have encountered (allowing for 0.1 % outliers in each run)
fortio
- (Fortio) HTTP / 1.1 and gRPC (HTTP / 2) and latency performance as with
wrk2but without Coordinated Omission
Memcached memtier
The setup consisted of the memcached database and the memtier database client running on the same system. Therefore, the thread count was divided by 2 to have both database and client use each one of the CPUs.
The benchmark pods run on the Kubernetes worker node with a run length of 30 seconds and multiple iterations directly after each other. Here are the effective command lines for the linked container images; the threads count is varied from half the number of CPU threads, to half the number of cores to a single thread:
Background database:memcached-t $ THREADS
Foreground client:memtier_benchmark-P memcache_binary -t $ THREADS --test -time 30 - Ratio 1: 1 -c 25 -x 1 --data-size-range=10240 - 1048576 --key-pattern S: S
The extra arguments specify that the ratio of get to set operations is 1: 1, 25 connections are used, one iteration (because we rerun the process for multiple iterations), an object size ranging from 10 KiB to 1 MiB, and a sequential key pattern for both get and set operations.
With memcached, Ampere’s eMAG benefits from its significantly higher multi-thread memory bandwidth, leading the field by a large margin. AMD’s EPYC offers a better price / performance ratio than Intel’s XEON.
Redis memtier
Redis is an in-memory key-value store, but compared to memcached above, it is single-threaded by nature. To test multiple cores / CPUs we launched multiple redis database instances and memtier client instances, and benchmarked in parallel and summed the results up.
The benchmark pods run on the Kubernetes worker node with a run length of 30 seconds and multiple iterations directly after each other. Here are the effective command lines for the linked container images; the process count is varied from half the number of CPU threads, to half the number of cores to a single process:
Background database processes:Redis--port $ PROCESS_PORT
Foreground client processes:memtier_benchmark-p $ PROCESS_PORT -P redis -t 1 --test-time 30 - Ratio 1: 1 -c 25 -x 1 --data-size-range=10240 - 1048576 --key-pattern S: S
The results for all processes are summed up in an additional step. The extra arguments specify that the ratio of get to set operations is 1: 1, 25 connections are used, one iteration (because we rerun the process for multiple iterations), an object size ranging from 10 KiB to 1 MiB, and a sequential key pattern for both get and set operations.
All three contenders perform about the same when compared at the physical cores level. With hyperthreading enabled – and the respective security implications accepted – Intel’s XEON clearly moves ahead of the field. AMD’s EPYC has a small gain from hyperthreading, too, leaving eMAG at the third position. AMD also excels at cost / performance running redis, with eMAG in the second position.
NGINX (AB)
We use Apache’s (ab) to benchmark NGINX ‘HTTP throughput in requests per second. As with all other network tests (iperf and the following latency tests), the client is an Intel XEON node in all cases and the TCP connections in Kubernetes are pod-to-pod over the Calico’s IP-in-IP overlay network. We used 56 connections because the fixed XEON client has 56 CPU threads.
The benchmark has a run length of 30 seconds and multiple iterations directly after each other.
The effective command lines for the linked containers are as follows:
Benchmarked worker node with server pod:(nginx)
Fixed XEON worker node with client pod:AB- C 56 -t 30 -n 999999999 http: // $ POD_IP: 8000 /(The high number of request just ensures that only the timeout of 30 seconds w ill terminate the benchmark and not the number of sent requests which is just 50000 by default.)
AMD’s EPYC and Intel’s XEON benefit from their significantly better networking performance (see the iperf benchmark above), leaving eMAG at the third position when raw performance is the main concern. Hyperthreading on both XEON and EPYC does not have a noticeable impact on performance, though it adds more jitter in performance when activated. Ampere’s eMAG benefits from its competitive pricing when cost is a concern, moving up to the second position.
(NGINX) wrk2
Wrk2 is somewhat of a Kinvolk favorite and has been used inprevious works of ours. It’s the only benchmark tool we’re aware of that takes Coordinated Omission into account, which is important for realistically measuring latency in overload situations. Wrk2 takes a constant request rate and calculates the latency from the point in time where the requestwould have been sentinstead of sending requests at the actual (possibly lower than requested) rate, and measuring individual requests’ latencies when the requests are actually sent.
As with all other network tests, the client is an Intel XEON node in all cases and the TCP connections in Kubernetes are pod-to-pod over the Calico’s IP-in-IP overlay network . We used 56 connections because the fixed XEON client has 56 CPU threads. The request rate is fixed to 2000 requests per second so that no system is overloaded (cf. the (AB) results above). The request body has a length of 100 bytes.
The benchmark has a run length of 60 seconds and multiple iterations directly after each other.
The effective command lines for the linked containers are as follows:
Benchmarked worker node with server pod:(nginx)
Fixed XEON worker node with client pod:WRK-d 60 S-C 56 -t 56 - R 2000 -L -s / usr / local / share / wrk2 / body - 100 - report.lua http: // $ POD_IP: 8000 /
The minimal observed p 999 latency was similar across all systems in all datacenter regions. However, there is a lot of jitter and cases with worse p (latency for the Intel XEON systems.)
We made a second run with Hyperthreading disabled (instead of forcing nginx to only use half of the CPU threads and because we cannot control the number of kernel threads of the network stack) and did not observe large jitter but also had less samples.
Not visible in the charts is that the Intel Xeon server is twice as expensive because there is no meaningful way to display the system cost in regards to the resulting latency since adding more parallel systems won ‘ t reduce the p 999 latency of a single system.
Fortioclient with afortioserver
We usefortioto measure p 999 latency, both for HTTP 1.1 as well as for gRPC (HTTP2). We used 20 connections and fixed the request rate to (REQ / S.)
As with all other network tests, the client is an Intel XEON node in all cases and the TCP connections in Kubernetes are pod-to-pod over the Calico’s IP-in-IP overlay network .
The benchmark has a run length of 60 seconds and multiple iterations directly after each other.
The effective command lines for the linked containers are as follows:
Benchmarked worker node with server pod:Fortioserver -ui-path ''
Fixed XEON worker node with client pod for HTTP / 1.1:Fortioload -c 20 -qps=2000 -t=60 s -payload-size=50 -keepalive=false $ POD_IP: 8080
For HTTP / 1.1 the observed minimal p 999 latencies across all systems and datacenter regions was similar. This time there was jitter for the AMD EPYC systems with outliers that distort the whole graph.
Ampere’s eMAG had p 999 latency of ~ 4ms, AMD’s EPYC ~ 3-4ms not counting the outliers in, and Intel’s XEON ~ 3-7ms.
We made a second run with Hyperthreading disabled (instead of fixingfortioto half of the CPU threads manually and because we cannot control the number of kernel threads of the network stack) and did not observe large jitter but also had less samples.
For gRPC (HTTP / 2) we used 20 connections but with 10 HTTP / 2 streams per TCP connection . The request rate was fixed to 2000 REQ / S.
The benchmark has a run length of 60 seconds and multiple iterations directly after each other.
The effective command lines for the linked containers are as follows:
Benchmarked worker node with server pod:Fortioserver -ui-path ''
Fixed XEON worker node with client pod for gRPC:Fortioload -grpc -s 10 -c 20 -qps=2000 -t=60 s -payload-size=50 -keepalive=fal se $ POD_IP: 8079
Both AMD’s Epyc and Intel’s XEON deliver solid latency results for gRPC, about 3 times their HTTP 1.1 latency. Ampere’s eMAG struggles with gRPC and displays massive jitter in its response times.
We made a second run with Hyperthreading disabled again and even though we had less samples in this run the previous findings were confirmed.
First of all, Lokomotive Kubernetes and Flatcar Container Linux worked well on arm 64 with Ampere’s eMAG. Even hybrid clusters with both arm (and x) nodes were easy to use either with multi-arch container images, or the built-in Kuberneteskubernetes.io/archlabels as node selectors.
Overall Ampere’s eMAG offers good price / performance ratio. Surprising benchmark results are those where we see Ampere’s eMAG leading for a certain set of use cases.
It excels at multi-thread performance, particularly with memory I / O heavy and throughput related workloads (e.g. multi-thread key-value stores and file operations on a tmpfs). These are the clear places where it would pay off to switch the server type. In conclusion the eMAG also feels well-positioned for cloud-native workloads, which tend to fully commit memory and compute resources to pods.
AMD’s EPYC has a slight integer / floating point processing advantage with vector arithmetics and is in the same cost range as eMAG, as well as faster IP-in-IP overlay networking, but suffers from lower overall multi-thread throughput. **********
Intel’s XEON, while leading with raw performance in a number of benchmarks, comes in last when cost is factored in.
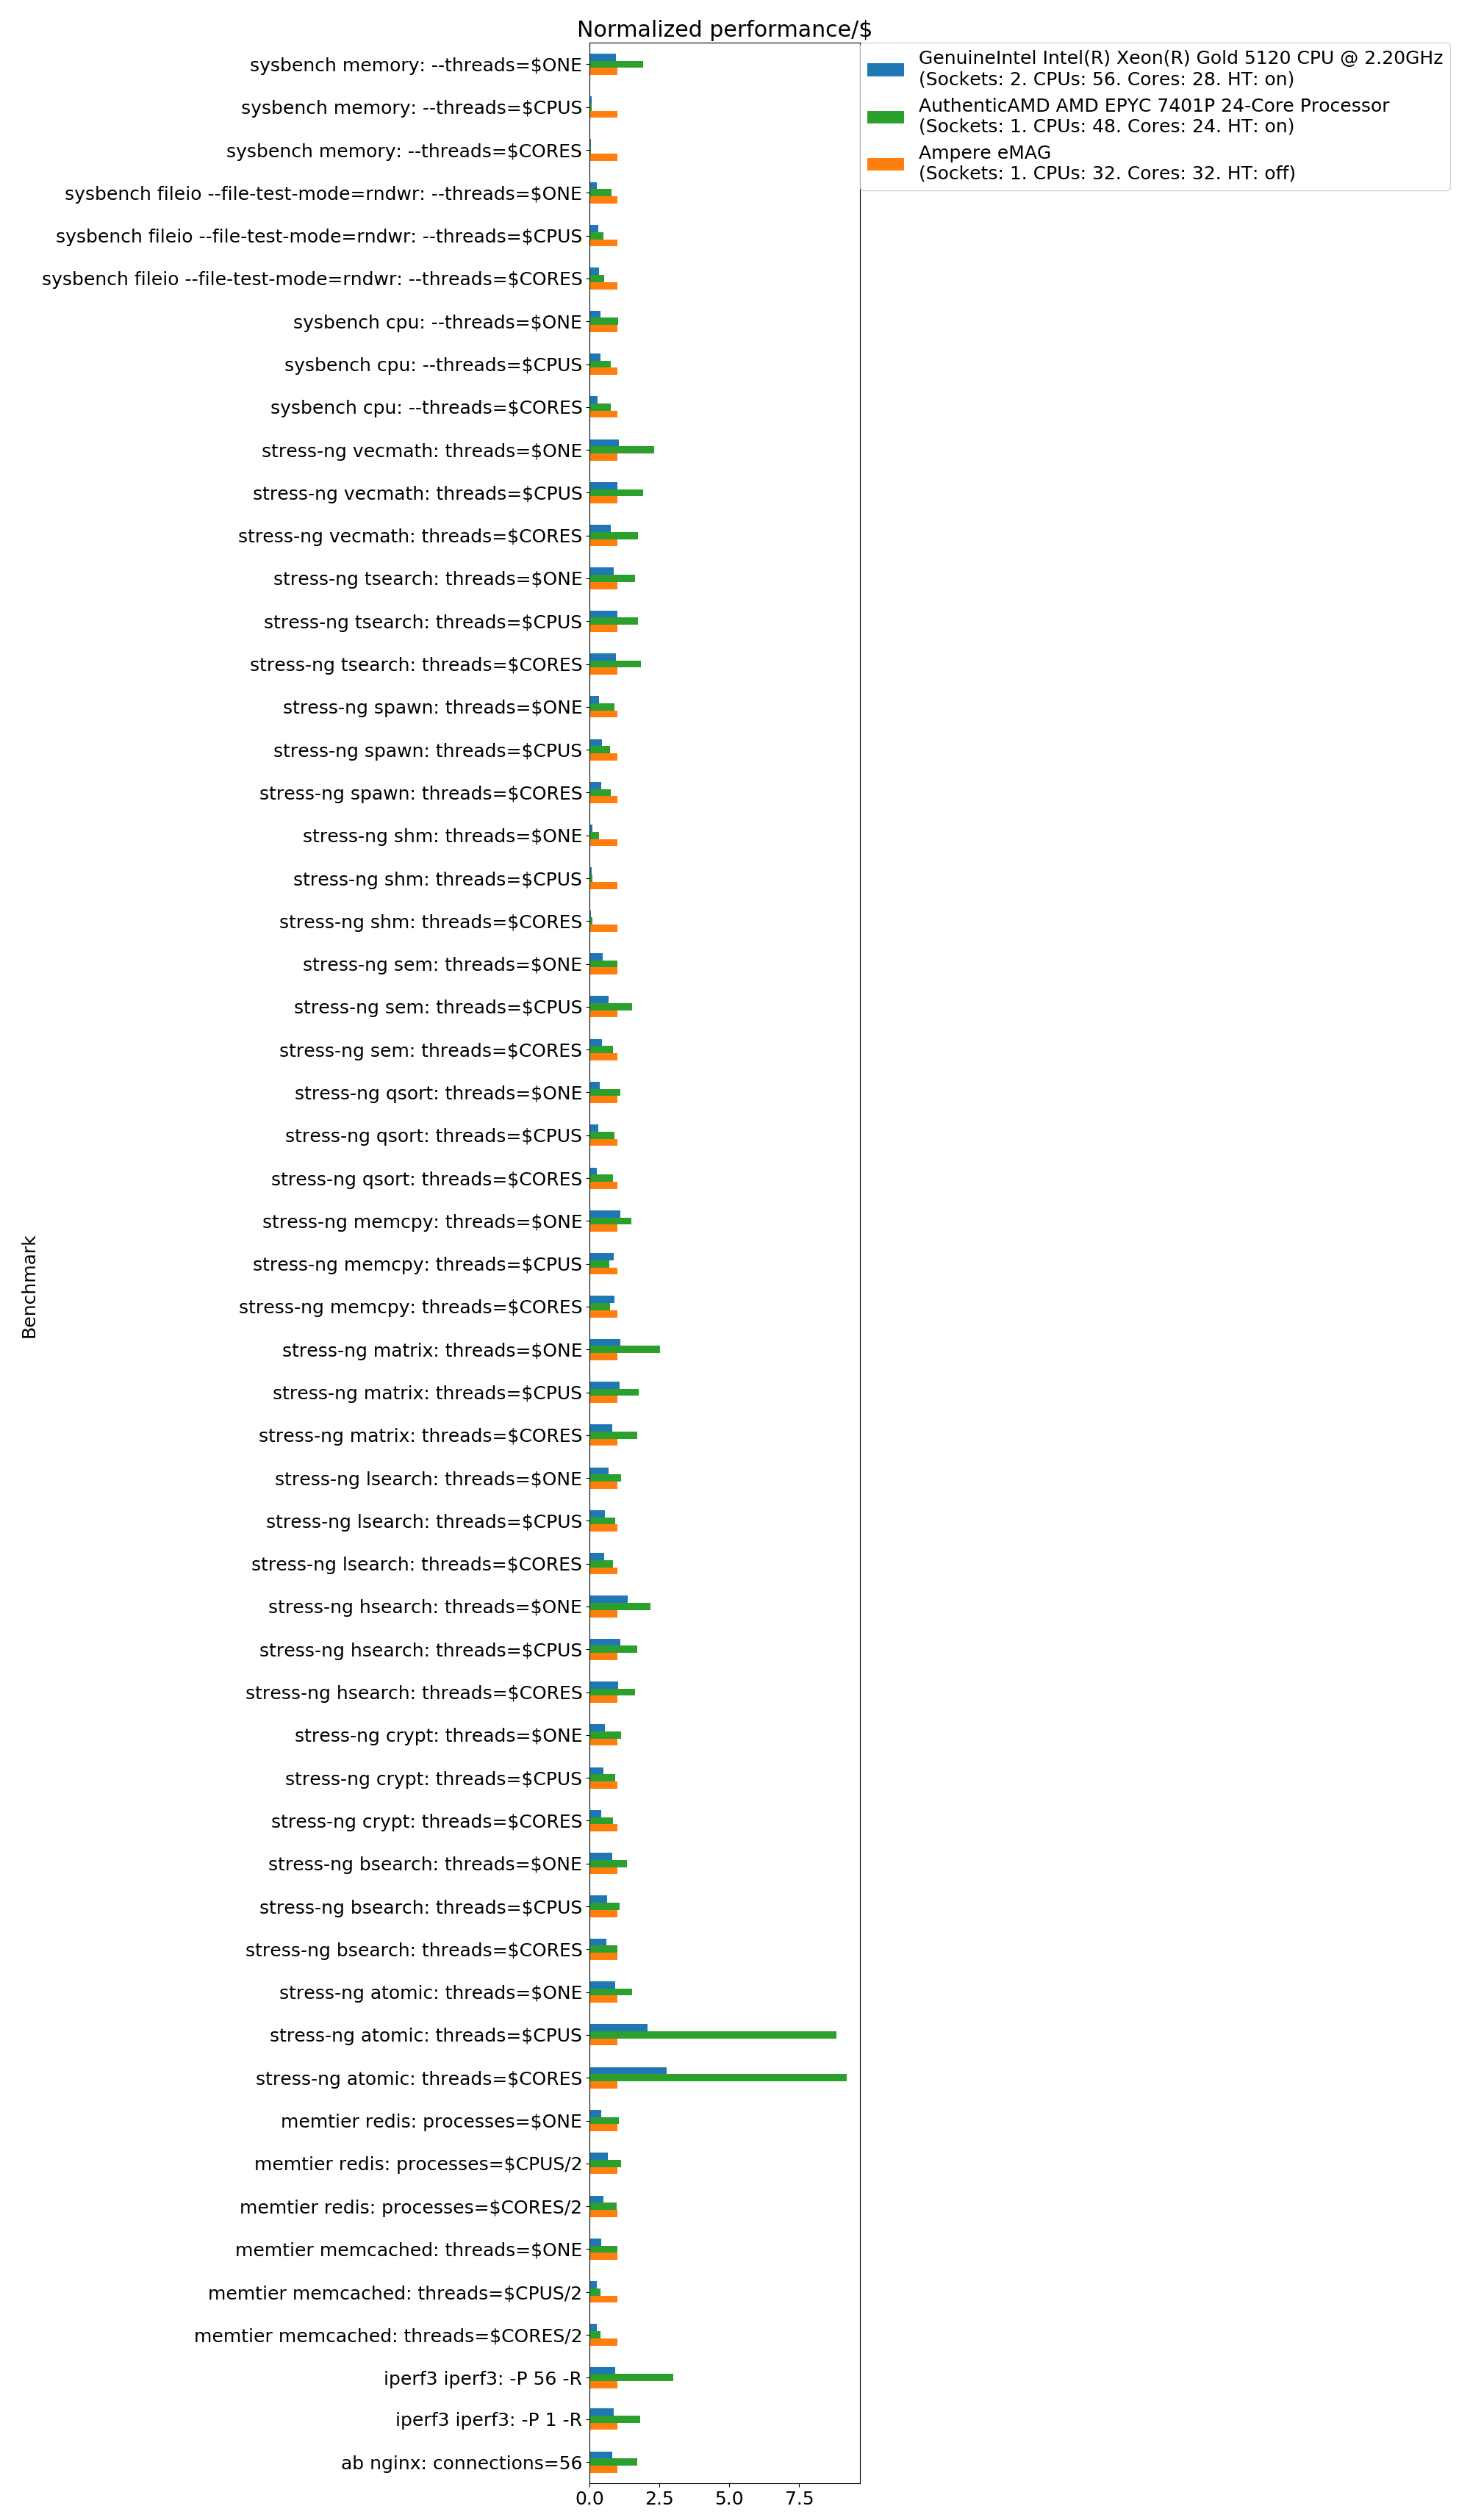
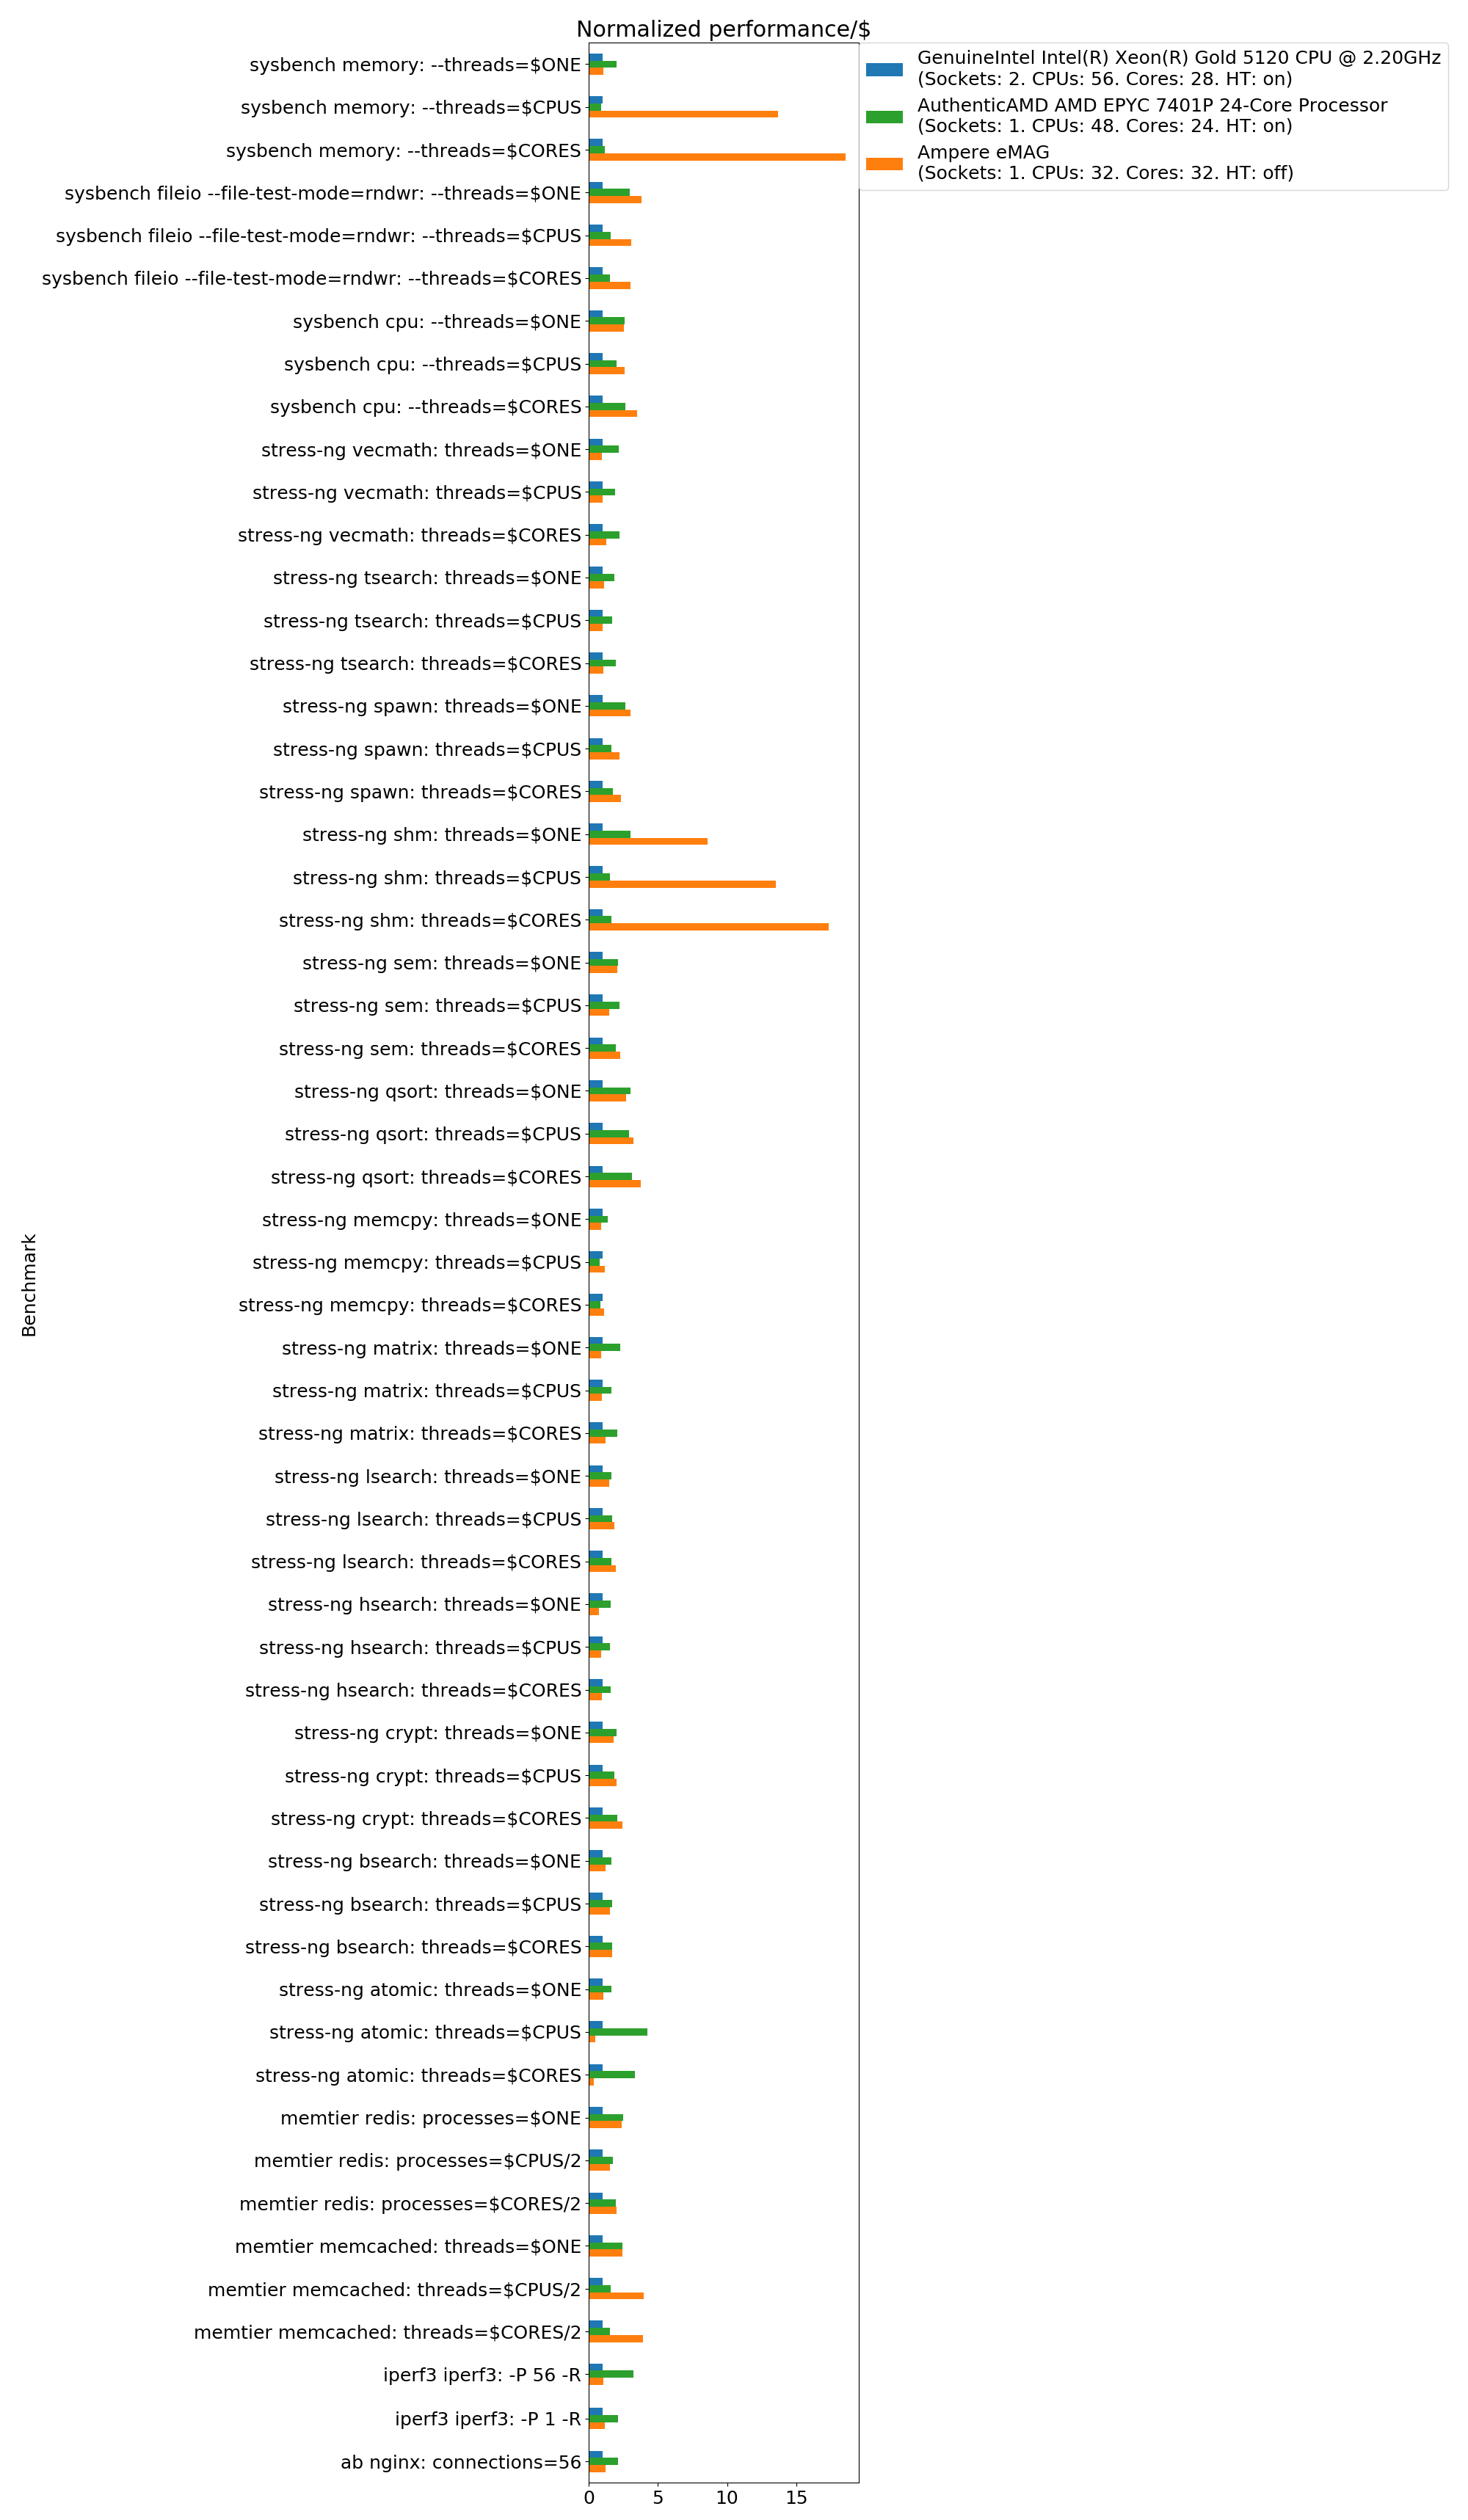
Attached is a performance-per-cost summary graph for the above benchmarks, normalized to the eMAG results, to the EPYC results, and to the XEON results for easy comparison.
Compiler and application optimizations for arm 64 will likely change the results in the future in particular for those cases where a huge difference was observed (the iperf IP-in-IP scenario is certainly a focus area where we can expect them soon, others are memcpy / memmov and atomics). It will also be interesting to repeat such a benchmark again on the next generations of the three manufacturers given the fact that the eMAG is the first offering of Ampere Computing. The benchmark code is here for reproducibility:https://github.com/kinvolk/benchmark-containers.
We are currently in the process of productizing and polishing Arm support in both Flatcar Container Linux and Lokomotive Kubernetes, and will announce general availability in the near future.
Benchmark tools and benchmark automation are publicly available, and may see support for other CPU architectures in the future.
(Appendix)
Normalized performance / cost summary graph for eMAG:
Normalized performance / cost summary graph for EPYC:
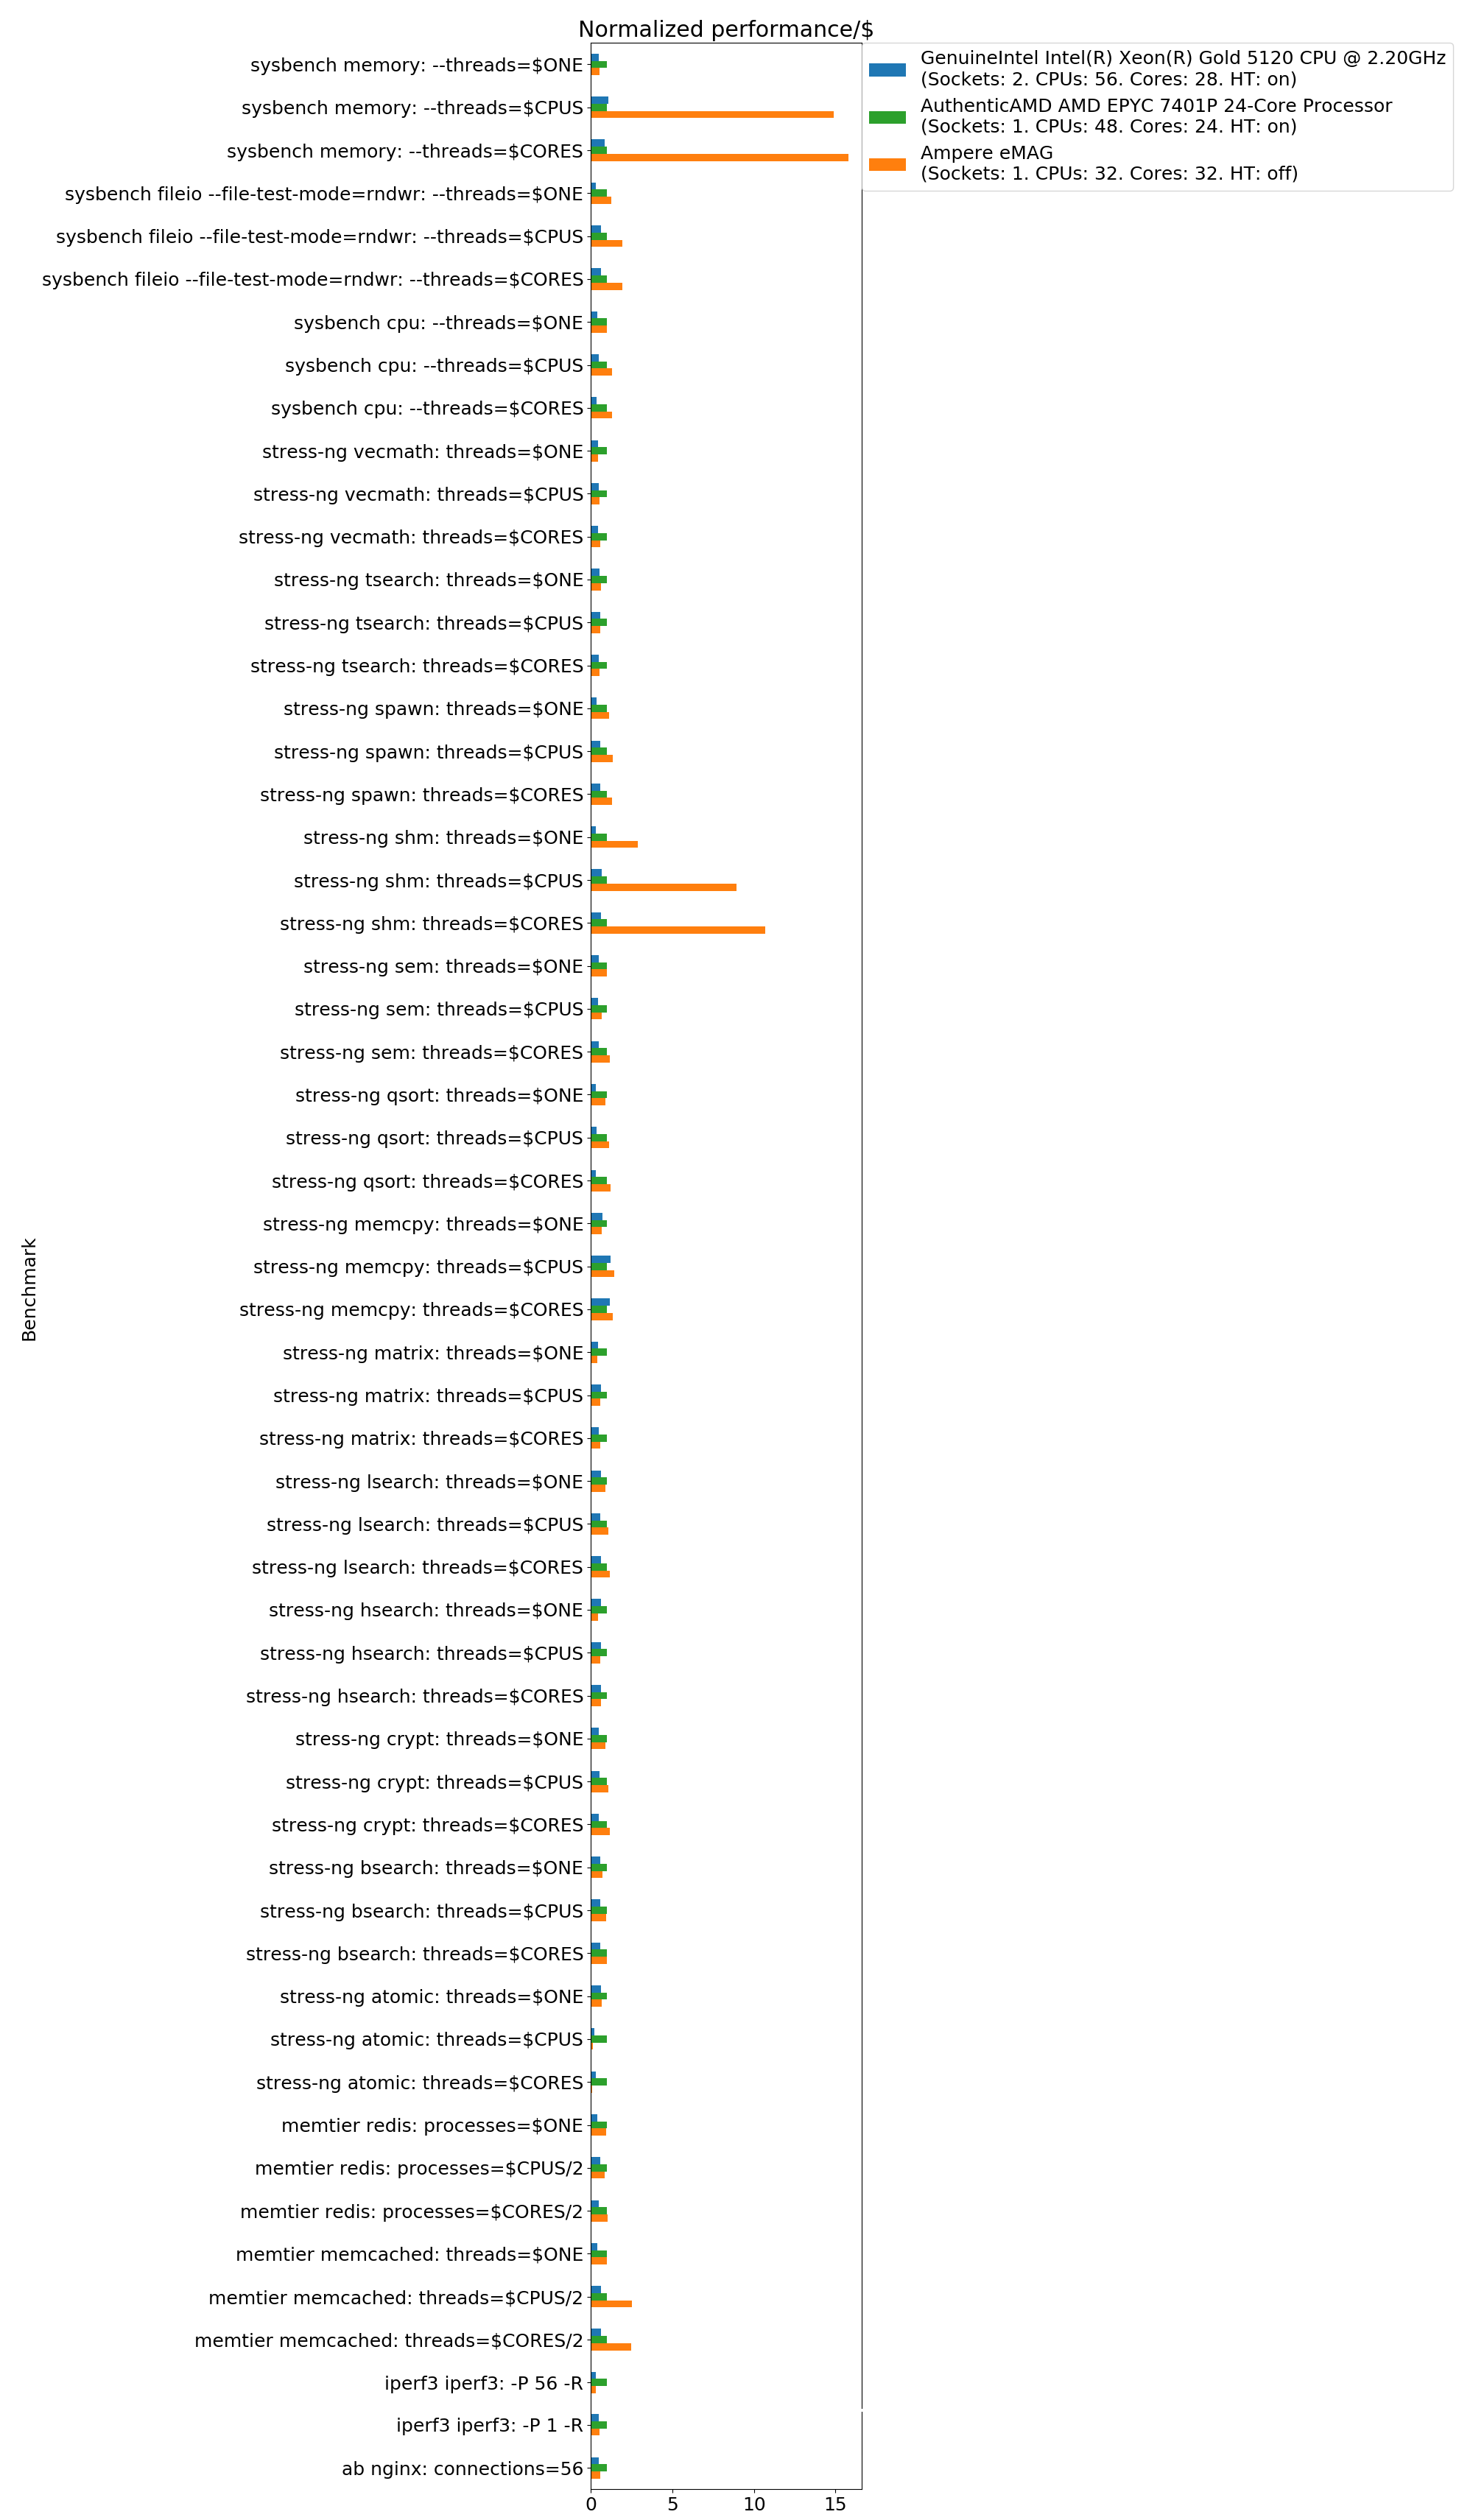
Normalized performance / cost summary graph for XEON:


GIPHY App Key not set. Please check settings