

![]()

roughViz.jsis a reusable JavaScript library for creating sketchy / hand-drawn styled charts in the browser, based on D3v5, roughjs, and handy.
Why?
Use these charts where the communication goal is to show intent or generality, and not absolute precision. Or just because they’re fun and look weird.
Features
Chart Types(more to come!)
- (Bar)
- Horizontal Bar ( (roughViz.BarH) )API.Example.
- Donut ( (roughViz.Donut) ) (API) .Example.
- Line ( (roughViz.Line) )API.Example.
- Pie ( (roughViz.Pie) )API.Example.
- Scatter ( (roughViz.Scatter)API.Example.
- Stacked Bar ( (roughViz.StackedBar) )API. (Example) .
roughViz.Bar) (API) .Example.
Apply the features ofroughjsto each chart:
roughness:
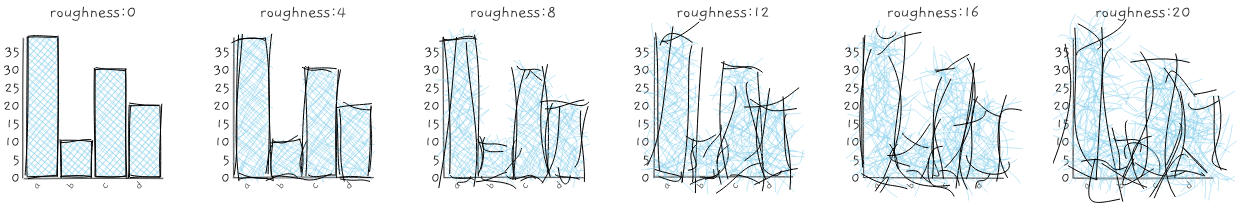
fillStyle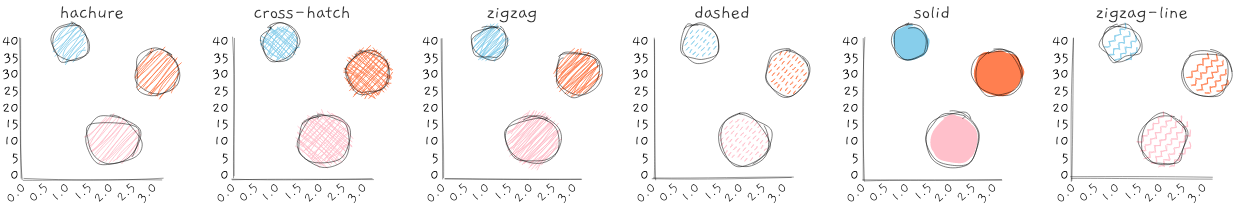
fillWeight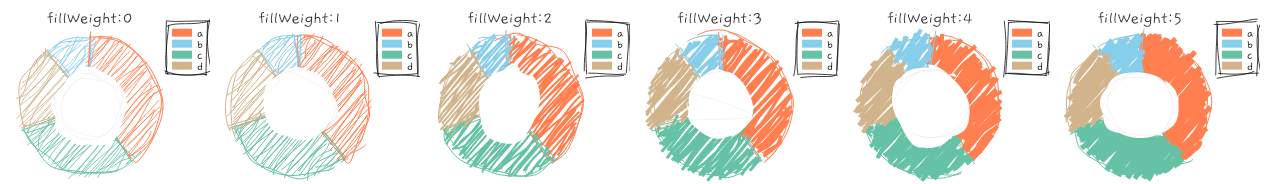
As well as additional chart-specific options (see API below)
Installation
Via CDN (expose the (roughViz) ********************************************** (global in) ********************************************* (html) ):
scriptSRC=" (https://unpkg.com/[email protected]) ">script>
Via (NPM) :
Want to use with (React) ?There’s a wrapper!:
Want to use it with (Python) ?There’s a wrapper!:
How to use
Create some container elements, one for each chart:
you can name each id whatever you want->divID="viz0""> (div)>divID="viz1""> (div)>
In the javascript, just create charts, referencing the desired container:
//create donut chart from csv file, using default options (new)roughViz.Bar({ element:'# vis0',//container selection data:'https://raw.githubusercontent.com/jwilber/random_data/master /flavors.csv'', labels:'flavor', values :'price'});//create Donut chart using defined data & customize plot options(new)roughViz.Donut( { element:'# vis1', data:{ labels:['North','South','East','West'], values :[10,5,8,3] }, title:"Regions", width:(window) .innerWidth/(4) , roughness:(8) , colors:['red','orange','blue','skyblue'], Stroke:'black', strokeWidth:(3) , fillStyle:'cross-hatch', fillWeight:(3.5) , } );
API
roughViz.Bar
Required
-
element[string]: Id or class of container element. -
data: Data with which to construct chart. Can be either an object or string.- If object: must contain
labelsandvalues keys:
newroughViz.Bar({ element:'.Viz', data:{labels:['a','b'], values :[10,20]} })
- If string: must be a path / url to a
csvor (TSV) , and you must also specify thelabelsandvalues as separate attributes that represent columns in said file:
newroughViz.Bar({ element:'# viz0', data:'stringToDataUrl.csv', labels:'nameOfLabelsColumn', values :'nameOfValuesColumn', })
- If object: must contain
Optional
axisFontSize[string]: Font-size for axes’ labels. Default:' 1rem '.- axisRoughness[number]: Roughness for x & y axes. Default:
0.5. - axisStrokeWidth[number]: Stroke-width for x & y axes. Default:
0.5. - bowing[number]: Chart bowing. Default:
0. - color[string]: Color for each bar. Default:
' skyblue '. - fillStyle[string]: Bar fill-style. Should be one offillStylesshown above.
- fillWeight[number]: Weight of inner paths’ color. Default:
0.5. - font: Font-family to use. You can use
0orgaeguto use (Gaegu) , or (1) orindie flowerto use Indie Flower . Or feed it something else. Default:Gaegu. - highlight[string]: Color for each bar on hover. Default:
' coral '. - innerStrokeWidth[number]: Stroke-width for paths inside bars. Default:
1. - interactive[boolean]: Whether or not chart is interactive. Default:
true. - labelFontSize[string]: Font -size for axes’ labels. Default:
' 1rem '. - ****************************************** (margin) [object]: Margin object. Default:
{ top: 50, right: 20, bottom: 70, left: 100} - Padding[number]: Padding between bars. Default:
0.1. - roughness[number]: Roughness level of chart. Default:
1. - Simplification[number]: Chart simplification. Default (0.2) .
- ****************************************** (stroke) [string]: Color of bars’ stroke. Default:
black. - strokeWidth[number]: Size of bars’ stroke. Default:
1. - title[string]: Chart title.
- titleFontSize[string]: Font -size for chart title. Default:
' 1rem '. - tooltipFontSize[string]: Font -size for tooltip. Default:
' 0. (Rem ') . - ****************************************** (xLabel) [string]: Label for x-axis.
- ****************************************** (yLabel) [string]: Label for y-axis.
(roughViz.BarH)
Required
-
element[string]: Id or class of container element. -
data: Data with which to construct chart. Can be either an object or string.- If object: must contain
labelsandvalues keys:
newroughViz.BarH({ element:'.Viz', data:{labels:['a','b'], values :[10,20]} })
- If string: must be a path / url to a
csvor (TSV) , and you must also specify thelabelsandvalues as separate attributes that represent columns in said file:
newroughViz.BarH({ element:'# viz0', data:'stringToDataUrl.csv', labels:'nameOfLabelsColumn', values :'nameOfValuesColumn', })
- If object: must contain
Optional
axisFontSize[string]: Font-size for axes’ labels. Default:' 1rem '.- axisRoughness[number]: Roughness for x & y axes. Default:
0.5. - axisStrokeWidth[number]: Stroke-width for x & y axes. Default:
0.5. - bowing[number]: Chart bowing. Default:
0. - color[string]: Color for each bar. Default:
' skyblue '. - fillStyle[string]: Bar fill-style. Should be one offillStylesshown above.
- fillWeight[number]: Weight of inner paths’ color. Default:
0.5. - font: Font-family to use. You can use
0orgaeguto use (Gaegu) , or (1) orindie flowerto use Indie Flower . Or feed it something else. Default:Gaegu. - highlight[string]: Color for each bar on hover. Default:
' coral '. - innerStrokeWidth[number]: Stroke-width for paths inside bars. Default:
1. - interactive[boolean]: Whether or not chart is interactive. Default:
true. - labelFontSize[string]: Font -size for axes’ labels. Default:
' 1rem '. - ****************************************** (margin) [object]: Margin object. Default:
{ top: 50, right: 20, bottom: 70, left: 100} - Padding[number]: Padding between bars. Default:
0.1. - roughness[number]: Roughness level of chart. Default:
1. - Simplification[number]: Chart simplification. Default (0.2) .
- ****************************************** (stroke) [string]: Color of bars’ stroke. Default:
black. - strokeWidth[number]: Size of bars’ stroke. Default:
1. - title[string]: Chart title.
- titleFontSize[string]: Font -size for chart title. Default:
' 1rem '. - tooltipFontSize[string]: Font -size for tooltip. Default:
' 0. (Rem ') . - ****************************************** (xLabel) [string]: Label for x-axis.
- ****************************************** (yLabel) [string]: Label for y-axis.
roughViz.Donut
Required
-
element[string]: Id or class of container element. -
data: Data with which to construct chart. Can be either an object or string.- If object: must contain
labelsandvalues keys:
newroughViz.Donut({ element:'.Viz', data:{labels:['a','b'], values :[10,20]} })
- If string: must be a path / url to a
csv, (json) , orTSV, and you must also specify thel abelsandvalues as separate attributes that represent columns in said file:
newroughViz.Donut({ element:'# viz0', data:'stringToDataUrl.csv', labels:'nameOfLabelsColumn', values :'nameOfValuesColumn', })
- If object: must contain
Optional
bowing[number]: Chart bowing. Default:0.- Colors[array]: Array of colors for each arc. Default:
['coral', 'skyblue', '#66c2a5', 'tan', '#8da0cb', '#e78ac3', '#a6d854', '#ffd92f', 'tan', 'orange']. - fillStyle[string]: Bar fill-style. Should be one offillStylesshown above.
- fillWeight[number]: Weight of inner paths’ color. Default:
0 . 85. - font: Font-family to use. You can use
0orgaeguto use (Gaegu) , or (1) orindie flowerto use Indie Flower . Or feed it something else. Default:Gaegu. - highlight[string]: Color for each arc on hover. Default:
' coral '. - innerStrokeWidth[number]: Stroke-width for paths inside arcs. Default:
0 . 75. - interactive[boolean]: Whether or not chart is interactive. Default:
true. - ****************************************** (legend) [boolean]: Whether or not to add legend. Default:
' true '. - ****************************************** (legendPosition) [string]: Position of legend. Should be either
'left'or' right '. Default:' right '. - ****************************************** (margin) [object]: Margin object. Default:
{ top: 50, right: 20, bottom: 70, left: 100} - Padding[number]: Padding between bars. Default:
0.1. - roughness[number]: Roughness level of chart. Default:
1. - Simplification[number]: Chart simplification. Default (0.2) .
- strokeWidth[number]: Size of bars’ stroke. Default:
1. - title[string]: Chart title.
- titleFontSize[string]: Font -size for chart title. Default:
' 1rem '. - tooltipFontSize[string]: Font -size for tooltip. Default:
' 0. (Rem ') .
roughViz.Line
Required
element[string]: Id or class of container element .- data: Must be a path / url to a
csvor (TSV) , and you must also specify the eachyas separate attributes that represent columns in said file. Each attribute prefaced with (y(exceptyLabel) receive its own line:(new)roughViz.Line({ element:'# viz0', data:'https://raw.githubusercontent.com/jwilber/random_data/master /profits.csv'', Y1:'Revenue', Y2:'cost', Y3:'profit'})
Optional
axisFontSize[string]: Font-size for axes’ labels. Default:' 1rem '.- axisRoughness[number]: Roughness for x & y axes. Default:
0.5. - axisStrokeWidth[number]: Stroke-width for x & y axes. Default:
0.5. - bowing[number]: Chart bowing. Default:
0. - circle[boolean]: Whether or not to add circles to chart. Default:
true. - circleRadius[number]: Radius of circles. Default:
10. - circleRoughness[number]: Roughness of circles. Default:
2. - Colors[array or string]: Array of colors for each arc. Default:
['coral', 'skyblue', '#66c2a5', 'tan', '#8da0cb', '#e78ac3', '#a6d854', '#ffd92f', 'tan', 'orange']. If string (eg (‘blue’) ), all circles will take that color. - fillStyle[string]: Bar fill-style. Should be one offillStylesshown above.
- fillWeight[number]: Weight of inner paths’ color. Default:
0.5. - font: Font-family to use. You can use
0orgaeguto use (Gaegu) , or (1) orindie flowerto use Indie Flower . Or feed it something else. Default:Gaegu. - interactive[boolean]: Whether or not chart is interactive. Default:
true. - labelFontSize[string]: Font -size for axes’ labels. Default:
' 1rem '. - ****************************************** (legend) [boolean]: Whether or not to add legend. Default:
true. - ****************************************** (legendPosition) [string]: Position of legend. Should be either
'left'or' right '. Default:' right '. - ****************************************** (margin) [object]: Margin object. Default:
{ top: 50, right: 20, bottom: 70, left: 100} - roughness[number]: Roughness level of chart. Default:
1. - Simplification[number]: Chart simplification. Default (0.2) .
- ****************************************** (stroke) [string]: Color of lines’ stroke. Default:
this .colors. - strokeWidth[number]: Size of lines’ stroke. Default:
1. - title[string]: Chart title.
- titleFontSize[string]: Font -size for chart title. Default:
' 0. (Rem ') . - tooltipFontSize[string]: Font -size for tooltip. Default:
' 0. (Rem ') . - ****************************************** (xLabel) [string]: Label for x-axis.
- ****************************************** (yLabel) [string]: Label for y-axis.
roughViz.Pie
Required
-
element[string]: Id or class of container element. -
data: Data with which to construct chart. Can be either an object or string.- If object: must contain
labelsand (values keys:
newroughViz.Pie({ element:'.Viz', data:{labels:['a','b'], values :[10,20]} })
- If string: must be a path / url to a
csv, (json) , orTSV, and you must also specify thelabelsandvalues as separate attributes that represent columns in said file:
newroughViz.Pie({ element:'# viz0', data:'stringToDataUrl.csv', labels:'nameOfLabelsColumn', values :'nameOfValuesColumn', })
- If object: must contain
Optional
bowing[number]: Chart bowing. Default:0.- Colors[array]: Array of colors for each arc. Default:
['coral', 'skyblue', '#66c2a5', 'tan', '#8da0cb', '#e78ac3', '#a6d854', '#ffd92f', 'tan', 'orange']. - fillStyle[string]: Bar fill-style. Should be one offillStylesshown above.
- fillWeight[number]: Weight of inner paths’ color. Default:
0 . 85. - font: Font-family to use. You can use
0orgaeguto use (Gaegu) , or (1) orindie flowerto use Indie Flower . Or feed it something else. Default:Gaegu. - highlight[string]: Color for each arc on hover. Default:
' coral '. - innerStrokeWidth[number]: Stroke-width for paths inside arcs. Default:
0 . 75. - interactive[boolean]: Whether or not chart is interactive. Default:
true. - ****************************************** (legend) [boolean]: Whether or not to add legend. Default:
true. - ****************************************** (legendPosition) [string]: Position of legend. Should be either
'left'or' right '. Default:' right '. - ****************************************** (margin) [object]: Margin object. Default:
{ top: 50, right: 20, bottom: 70, left: 100} - Padding[number]: Padding between bars. Default:
0.1. - roughness[number]: Roughness level of chart. Default:
1. - Simplification[number]: Chart simplification. Default (0.2) .
- strokeWidth[number]: Size of bars’ stroke. Default:
1. - title[string]: Chart title.
- titleFontSize[string]: Font -size for chart title. Default:
' 1rem '. - tooltipFontSize[string]: Font -size for tooltip. Default:
' 0. (Rem ') .
roughViz.Scatter
Required
-
element[string]: Id or class of container element. -
data: Data with which to construct chart. Can be either an object or string.- If object: must contain (x) and
Ykeys:
newroughViz.Scatter({ element:'.Viz', data:{x) :[1,2,35], Y:[10,20,8]} })
- If string: must be a path / url to a
csvor (TSV) , and you must also specify thexand (Y) as separate attributes that represent columns in said file:
newroughViz.Scatter({ element:'# viz0', data:'stringToDataUrl.csv', x:'nameOfLabelsColumn', Y:'nameOfValuesColumn', })
- If object: must contain (x) and
Optional
axisFontSize[string]: Font-size for axes’ labels. Default:' 1rem '.- axisRoughness[number]: Roughness for x & y axes. Default:
0.5. - axisStrokeWidth[number]: Stroke-width for x & y axes. Default:
0.5. - bowing[number]: Chart bowing. Default:
0. - Colors[array or string]: Array of colors for each arc. Default:
['coral', 'skyblue', '#66c2a5', 'tan', '#8da0cb', '#e78ac3', '#a6d854', '#ffd92f', 'tan', 'orange']. If string (eg (‘blue’) ), all circles will take that color. - colorVar[string]: If input data is
CSVorTSV, this should be an ordinal column with which to color points by.curbZero[boolean]: Whether or not to force (x, y) axes to (0, 0). Default:false. - fillStyle[string]: Bar fill-style. Should be one offillStylesshown above.
- fillWeight[number]: Weight of inner paths’ color. Default:
0.5. - font: Font-family to use. You can use
0orgaeguto use (Gaegu) , or (1) orindie flowerto use Indie Flower . Or feed it something else. Default:Gaegu. - highlight[string]: Color for each bar on hover. Default:
' coral '. - highlightLabel[string]: If input data is
CSVorTSV, this should be a column representing what value to display on hover. Otherwise,x, y)values will be shown on hover. - innerStrokeWidth[number]: Stroke-width for paths inside circles. Default:
1. - interactive[boolean]: Whether or not chart is interactive. Default:
true. - labelFontSize[string]: Font -size for axes’ labels. Default:
' 1rem '. - ****************************************** (margin) [object]: Margin object. Default:
{ top: 50, right: 20, bottom: 70, left: 100} - ra dius: Circle radius. Default:
8. - roughness[number]: Roughness level of chart. Default:
1. - Simplification[number]: Chart simplification. Default (0.2) .
- ****************************************** (stroke) [string]: Color of circles’ stroke. Default:
black. - strokeWidth[number]: Size of circles’ stroke. Default:
1. - title[string]: Chart title.
- titleFontSize[string]: Font -size for chart title. Default:
' 0. (Rem ') . - tooltipFontSize[string]: Font -size for tooltip. Default:
' 0. (Rem ') . - ****************************************** (xLabel) [string]: Label for x-axis.
- ****************************************** (yLabel) [string]: Label for y-axis.
roughViz.StackedBar
Required
-
element[string]: Id or class of container element. -
data: Data with which to construct chart. Should be an object. -
labels: String name of label key in (data) object.(new)roughViz.StackedBar({ element:'# vis0', data:[ {month:'Jan',A:20,B:5}, {month:'Feb',A:25,B:10}, ], labels:'month', })
Optional
axisFontSize[string]: Font-size for axes’ labels. Default:' 1rem '.- axisRoughness[number]: Roughness for x & y axes. Default:
0.5. - axisStrokeWidth[number]: Stroke-width for x & y axes. Default:
0.5. - bowing[number]: Chart bowing. Default:
0. - Colors[string]: Array of colors for each bar grouping.
- fillStyle[string]: Bar fill-style. Should be one offillStylesshown above.
- fillWeight[number]: Weight of inner paths’ color. Default:
0.5. - font: Font-family to use. You can use
0orgaeguto use (Gaegu) , or (1) orindie flowerto use Indie Flower . Or feed it something else. Default:Gaegu. - highlight[string]: Color for each bar on hover. Default:
' coral '. - innerStrokeWidth[number]: Stroke-width for paths inside bars. Default:
1. - interactive[boolean]: Whether or not chart is interactive. Default:
true. - labelFontSize[string]: Font -size for axes’ labels. Default:
' 1rem '. - ****************************************** (margin) [object]: Margin object. Default:
{ top: 50, right: 20, bottom: 70, left: 100} - Padding[number]: Padding between bars. Default:
0.1. - roughness[number]: Roughness level of chart. Default:
1. - Simplification[number]: Chart simplification. Default (0.2) .
- ****************************************** (stroke) [string]: Color of bars’ stroke. Default:
black. - strokeWidth[number]: Size of bars’ stroke. Default:
1. - title[string]: Chart title.
- titleFontSize[string]: Font -size for chart title. Default:
' 1rem '. - tooltipFontSize[string]: Font -size for tooltip. Default:
' 0. (Rem ') . - ****************************************** (xLabel) [string]: Label for x-axis.
- ****************************************** (yLabel) [string]: Label for y-axis.
Contributors [object]
- (Jared Wilber)
- [Dave Slutzkin [ (https://github.com/daveslutzkin)
- JoLo
Acknowledgments
This library wouldn’t be possible without the following people:
License
MIT License
Copyright (c) (Jared Wilber)
Permission is hereby granted, free of charge, to any person obtaining a copy of this software and associated documentation files (the “Software”), to deal in the Software without restriction, including without limitation the rights to use, copy, modify, merge, publish, distribute, sublicense, and / or sell copies of the Software, and to permit persons to whom the Software is furnished to do so , subject to the following conditions:
The above copyright notice and this permission notice shall be included in all copies or substantial portions of the Software.
THE SOFTWARE IS PROVIDED “AS IS”, WITHOUT WARRANTY OF ANY KIND, EXPRESS OR IMPLIED, INCLUDING BUT NOT LIMITED TO THE WARRANTIES OF MERCHANTABILITY, FITNESS FOR A PARTICULAR PURPOSE AND NONINFRINGEMENT. IN NO EVENT SHALL THE AUTHORS OR COPYRIGHT HOLDERS BE LIABLE FOR ANY CLAIM, DAMAGES OR OTHER LIABILITY, WHETHER IN AN ACTION OF CONTRACT, TORT OR OTHERWISE, ARISING FROM, OUT OF OR IN CONNECTION WITH THE SOFTWARE OR THE USE OR OTHER DEALINGS IN THE SOFTWARE.


GIPHY App Key not set. Please check settings