

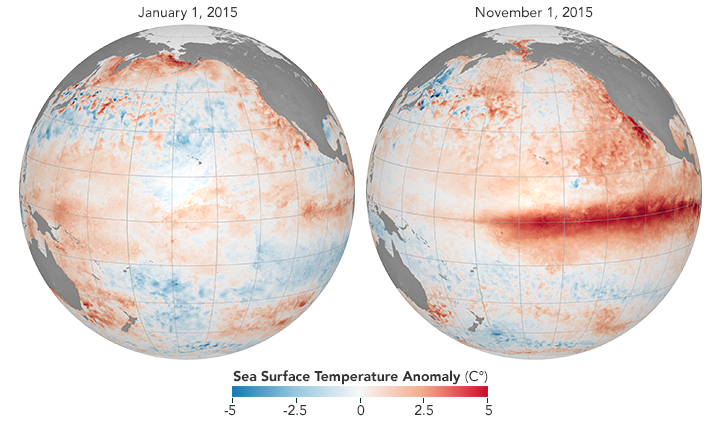
Enlarge/A strong El Niño developed in 2019, visible here from temperature departures from average.
We generally think of weather as something that changes by the day, or the week at the most. But there are also slower patterns that exist in the background, nudging your daily weather in one direction or another. One of the most consequential is the El Niño Southern Oscillation — a pattern of sea surface temperatures along the equatorial Pacific that affects temperature and precipitation averages in many places around the world.
In the El Niño phase of this oscillation, warm water from the western side of the Pacific leaks eastward toward South America, creating a broad belt of warm water at the surface. The opposite phase, known as La Niña, sees strong trade winds blow that warm water back to the west, pulling up cold water from the deeps along South America. The Pacific randomly wobbles between these phases from one year to the next, peaking late in the calendar.
Since this oscillation has such a meaningful impact on weather patterns — from heavy precipitation in California to drought in Australia — forecasting the wobble can provide useful seasonal outlooks. And because it changes fairly slowly, current forecasts are actually quite good out to about six months. It would be nice to extend that out further, but scientists have repeatedly run into what they’ve termed a “spring predictability barrier.” Until they see how the spring season plays out, the models have a hard time forecasting the rest of the year .
A new study led by Jun Meng, Jingfang Fan, and Josef Ludescher at the Potsdam Institute for Climate Impact Research showcases a creative new method that might hop that barrier.
This method doesn’t involve a better simulation model or some new source of data. Instead, it analyzes sea surface temperature data in a new way, generating a prediction of the strength of El Niño events a full year in advance. That analysis, borrowed from medical science, measures the degree of order or disorder (that is, entropy) in the data. It turns out that years with high disorder tend to precede strong El Niño events that peak a year later.
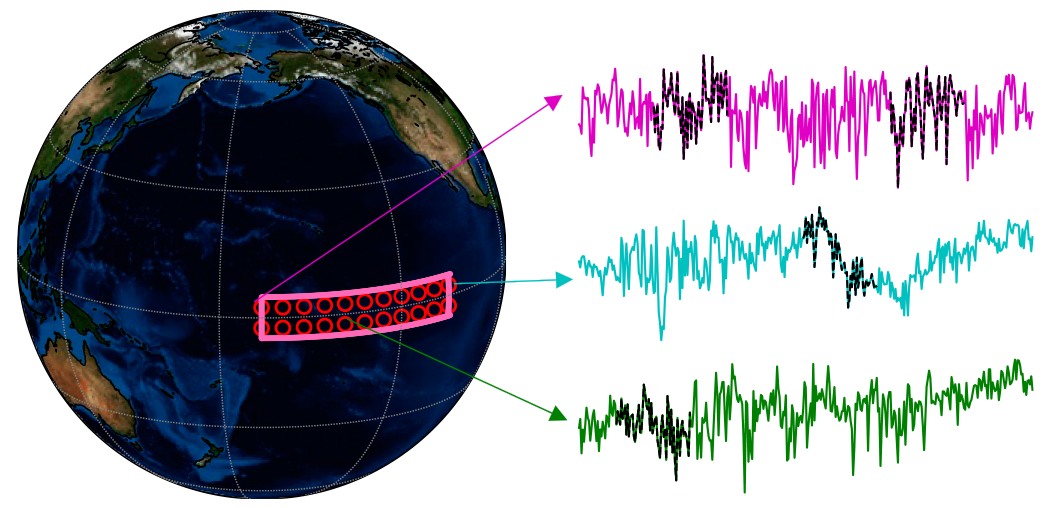
What does it mean for the data to be disorderly? Essentially, the analysis looks for signs that temperatures in different locations across the relevant portion of the Pacific are changingin sync with each other. The researchers broke the area into 423 grid boxes, Comparing temperature in each box to the others for consistent patterns.
Enlarge/An example of temperature data from different grid boxes within the region used to measure the El Niño Southern Oscillation. ********** **********************
(Read More)********


GIPHY App Key not set. Please check settings