
(Dec)
0. How to read me?
Yes, I know, it’s a long text, and it was my conscious decision to write it in this way. But fear not! Imagine that you read a book, take a look at the introduction and first few interesting sections, think about it and then find time to read further. I hope I’ve left enough references, so if you don’t get some ideas you’ll be able to read more information about interesting parts. Or you can even skip some sections, since they are relatively independent. This table of contents will guide you:
1. Introduction
In mathematics it is too easy to concentrate very hard on one specific problem. If your methods are not good enough to handle the problem, you will eventually grind to a halt, baffled and defeated. Often the key to further progress is to stand back, forget about the special problem, and see if you can spot any general features of the surrounding area which might be of use.
Ian Stewart, Concepts of Modern Mathematics.
It’s not a secret that databases are damn complicated systems. And they tend to run on top of even more complicated stacks of software. Nowadays you will not surprise anyone (or at least not that much) by running your database on a Kubernetes cluster or inside a virtual machine. It’s probably still questionable whether it’s good and appropriate, but this approach is something we have to face – sometimes it’s at least convenient, sometimes it allows to be more resource efficient and sometimes it’s the only available infrastructure in a company.
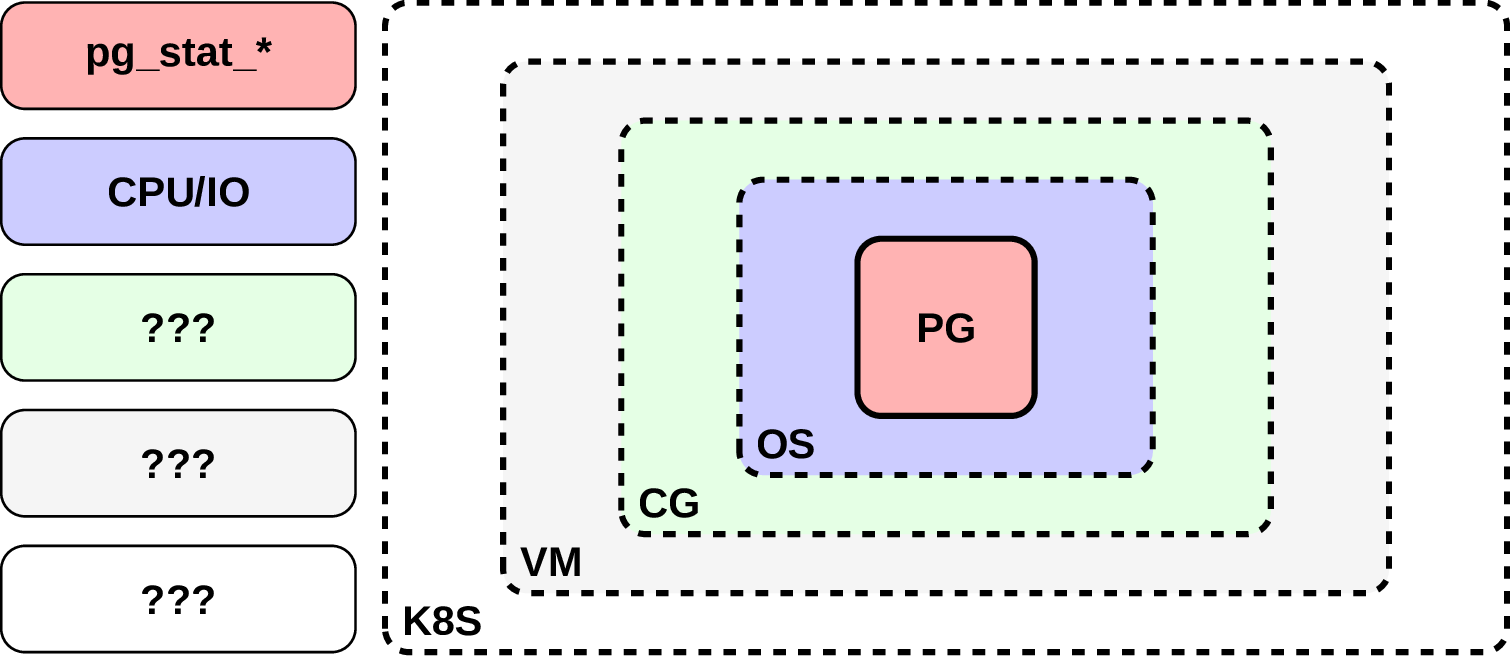
And one of the problems in this situation is that reasoning about the performance is not that easy any more. Well, it’s not like it was much easier before, but still. An issue, that could be in a database and sometimes in OS configuration, now has much more places to hide. At the same time every piece of software we have in our layers provide different and rather not unified ways to analyze its performance. In this kind of situations what usually happens if we’ve been hit by a strange and transient performance bug, hidden so well in between? Most of the time people tend to use a “time efficient” solution, like scaling up or restarting the whole thing, just to make this problem go away. Not only it usually returns, but people also loosing an important knowledge for themselves and for a community of whatever software they use.
All of this make me think that quite often it would be very beneficial to stand back, forget about one particular layer of the system and apply more holistic approach to the problem. Ironically this holistic approach would mean an investigation of what’s going on a low level, since everything would be presented there relatively unified and without that much of borders between different layers. For example, let’s remember what happens when a database specialist is after a slow query? Well, most of the time there is a long stare at the query plan in attempt to understand how the database will execute it, and then change of the query, or dataset, or rarely the database parameters. But no matter how long we will stare at it, in this way it’s impossible to figure out that the query became slower e.g. due to the database, that runs on a K8S node, got few noisy neighbors scheduled on the same node.
But so far it sounds too fuzzy. What if you want to apply this approach, how would you do this? Just randomly and without any plan using utilities you’ve found on the internet?
So this is how a performance analysis looks like, people with expensive tools running around. Not how I pictured it.
Elliot Alderson could have said that
Fortunately no, there is a niceGuidelinefrom Brendan Gregg, that also includes frequent anti-patterns. One of the mentioned methods I find especially practical isUSE, that could be summarized as:
For every resource, check utilization, saturation, and errors.
If you’re interested more in computational performance, I can also suggestTop-Down performance analysis. Taking this into account will help you to solve a lot of complicated performance issues.
Having said all of that, now I want to show few examples for situations that I find interesting or useful, when one can use tools from the outside of the Postgres itself to figure out what’s going on.
What if you want to execute some analytical query against your relatively fresh Postgres installation, and suddenly see this:
ERROR: could not resize shared memory segment "/PostgreSQL.699663942 "to 50438144 bytes: No space left on deviceSeems pretty strange, and it’s actually not that easy to get more insight from the logs. But if you’re curious enough, spin up (strace) , attach it to your Postgres backend, and see what system calls your database is doing. There is even not that well known option– k, that allow us to see the stack trace between each syscall! There is an (information) that this options is not available everywhere, so maybe you need to compilestraceyourself for that, but I would even advise you to do so, since it’s relatively trivial and allow you to transform it more for your needs (e.g. statically compiledstracecan be pretty useful). Anyway, what can we see using this tool?
# strace -k -p PID openat (AT_FDCWD, "/dev/shm/PostgreSQL.62223175 " ftruncate (176, 50438144)=0 fallocate (176, 0, 0, 50438144)=-1 ENOSPC >libc-2. 27 .so (posix_fallocate 0x 16) [0x114f76] >postgres (dsm_create 0x 67) [0x377067] ... >postgres (ExecInitParallelPlan 0x 360) [0x254a80] >postgres (ExecGather 0x 495) [0x269115] >postgres (standard_ExecutorRun 0xfd) [0x25099d] ... >postgres (exec_simple_query 0x 19 f) [0x39afdf]Now things are getting clear. We know that starting from PostgreSQL 10 query parallelism was significantly improved, and it seems like out backend indeed was doing something with parallel workers here. Each parallel worker require some amount of dynamic shared memory, which in case of POSIX implementation allocates something under/ dev / shm. And now we do something, what software engineers usually don’t do – read the documentation, from which we learn that default value for/ dev / shmsize in Docker isMb. Sometimes it could be not enough, and we’re in troubles.
3. vDSO
One can say that the previous example is a cheat, since obviously it’s rather complicated to analyze an issue in some software from the software itself, so here is another one. There is a nice Linux kernel mechanism called vDSO (virtual dynamic shared object). It allows us to call some kernel space routines in-process, without incurring the performance penalty of a mode switch from user to kernel mode. Some of those routines are quite important for databases, e.g.gettimeofday. But unfortunately this mechanism is not always available on VMs, it depends on a hypervisor (see more details in this niceblogpost). And now imagine you have a situation, when your K8S cluster consists of mixture of nodes from different AWS generations, how to figure out on which of them your databases are doing extra work? Attachstrace, and see if there are any real system calls done:
# strace -k -p PID on XEN gettimeofday ({tv_sec=1550586520, tv_usec=313499}, NULL)=04. CPU migrations
Here I have few naive experiments with pgbench on my laptop. Not exactly reliable benchmarking setup, but good enough to show some interesting stuff. The first experiment was running some heavy stuff, sorting a lot of data. In the second experiment I’ve utilized cool pgbench option– file=filename [@weight]to use different scripts in specified proportions, and the second script was doing something short, just select one record by index:
# Experiment 1 SQL script: pg_long.sql - latency average=1312. 903 ms # Experiment 2 SQL script 1: pg_long.sql - weight: 1 (targets 50. 0% of total) - latency average=1426. 928 ms SQL script 2: pg_short.sql - weight: 1 (targets 50. 0% of total) - latency average=303. 092 msI was a bit confused, when I saw the results. Why when we replace half of the heavy workload with something more lightweight, it’s getting worse? It’s one of those situations, when no matter how silly is the combination of parameters, it’s always interesting to check why. Most likely our bottleneck is not some syscall, sostracewill not help and probably we need to deployperfto record hardware performance events:
# perf record -e cache-misses, cpu-migrations # Experiment 1 12, 396, 382, 649 cache-misses # 28. 562% % 2, 750 CPU-migrations # Experiment 2 20, 665, 817, 234 cache-misses # 28. 533% 10, 460 CPU-migrationsNow we see something interesting. My original idea that it has something to do with cache misses is wrong, in both cases this metrics is almost the same. ButCPU-migrationsis three times bigger for the second experiment, due to different type of workload introducing disbalance in CPU consumption and not big enough value forsched_migration_cost_nsmake kernel think that it makes sense to migrate backends between CPUs. Most likely that’s the reason for our higher latency.
5. MDS
I know, everyone tired of hardware vulnerabilities. But they are good opportunity to practice your profiling skills, so I just can’t resist to write this section. MDS (Microarchitectural Data Sampling) is another of those issues similar to Meltdown and Specter. Every such public vulnerability has an extra mitigation mechanism in the Linux kernel and it means an overhead of some kind. Actually, there is a niceOverviewof what does it mean for Postgres, but let’s imagine for a minute that we live in a fantasy world where there is no Andres Freund. How would you evaluate an influence of this mitigation for your database? Well, let’s start to profile:
# Children Self Symbol # ........ ........ ................................. .. 71. 06% 0. 00% [.] __libc_start_main 71. 06% 0. 00% [.] PostmasterMain 56. 82 % 0. 14% [.] exec_simple_query 25. 19% 0. 06% [k] entry_SYSCALL _ 64 _ after_hwframe 25. (% 0.) % [k] do_syscall _ 64 23. 60% 0. (%) standard_ExecutorRunIf we would compare this profile, taken from a system with mitigation in place, with another one without it, we will notice thatdo_syscall _ 64is suddenly quite at the top. What does it mean? No idea, let’s zoom in:
# Percent Disassembly of kcore for cycles # ........ ................................ 0. 01%: nopl 0x0 (% rax,% rax , 1) 28. 94%: verw 0xffe9e1 (% rip) 0. 55%: pop% rbx 3. 24%: pop% rbpOh, here we are. We know via our strange habit of reading the documentation, that the mitigationmechanism for MDSimplies overloading (verw) instruction to flush CPU buffers, which kernel does viamds_clear_cpu_buffers (). And exactly that we can see in our profile! But please be aware ofSkid, since sometimes collected samples could be corresponding to the wrong instruction.
6. Lock holder / waiter preemption
Have you heard about such thing? It turns out it’s quite a problem, even worth few white papers, e.g. from (Usenix) or (WAMOS) . Let’s try to understand where is this issue coming from. Imagine we have a Postgres running inside a VM and taking two vCPU (vC1, vC2):
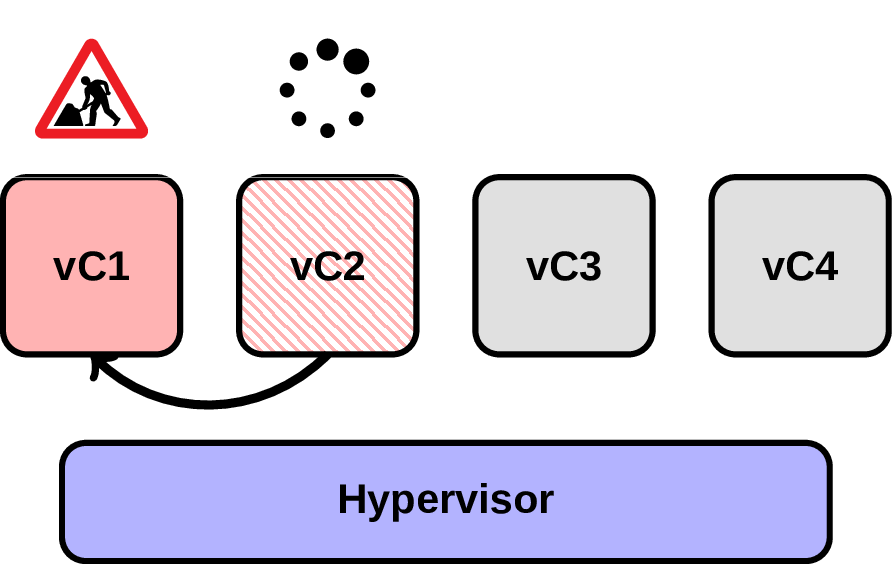
In this scenario at some point the backend on vC2 is waiting on a spin lock for something owned by another backend on vC1. Normally it’s not a problem, but what happens if hypervisor will suddenly decide to preempt vC1?
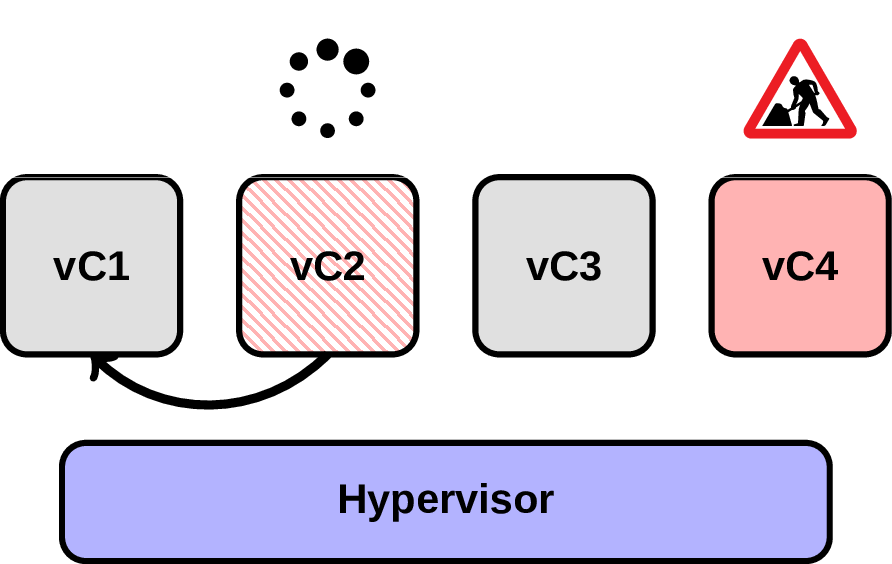
Now we’re in troubles, because what supposed to be a short waiting time for the first backend now takes who knows how long. Fortunately for us there are such technologies as IntelPAUSE-Loop Exitingthat are able to prevent useless spinning via sending (VM exit) to a corresponding VM. Or not fortunately, since of course it introduces an overhead of switching between VM and hypervisor, and if a pause was triggered incorrectly then this overhead was for nothing.
And now the question, how to measure it? Well, probably we can take a look at what kind of VM related tracepointsperfcan offer to us. For KVM there is actually akvm: kvm_exitevent, which also contains a reason code for an exit. Let’s try to run Postgres inside a KVM (with number of vCPU more that real cores) and see:
# experiment 1: pgbench, read write # latency average=17. 782 ms $ modprobe kvm-intel ple_gap=128 $ perf record -e kvm: kvm_exit # reason PAUSE_INSTRUCTION 306795# experiment 2: pgbench, read write # latency average=16. 858 ms $ modprobe kvm-intel ple_gap=0 $ perf record -e kvm: kvm_exit # reason PAUSE_INSTRUCTION 0In the first experiment we keep the default configuration for PLE and see that we’ve recorded quite a number of pause instructions. In the second experiment we disable PLE completely, and not surprisingly got 0 pause instructions. And you know what? In the second experiment our average latency was visibly lower! Most likely it means that our CPUs were too much oversubscribed, and PLE was falsely identifying real waiting for useless and pausing them.
7. Huge pages
Somehow it happened that in databases world people not always understand what huge pages are and when they are useful. Let’s apply our secret weapon to fight this off. First, do not mix up classical huge pages with transparent huge pages. The last one is a daemon that tries to merge regular memory pages into a huge pages in background and usually it’s advised to disable it due to unpredictable resource consumption. Now let’s check thedocumentation:
Usage of huge pages significantly reduces pressure on TLB, improves TLB hit-rate and thus improves overall system performance.
Interesting, but how can we check what does it mean for our databases? No surprise, there are TLB related tracepoints we can record viaperf:
# Experiment 1, pgbench read / write, huge_pages off # perf record -e dTLB-loads, dTLB-stores -p PID Samples: 894 K of event 'dTLB-load-misses' Event count (approx.): 784439650 Samples: 822 K of event 'dTLB-store-misses' Event count (approx.): 101471557 # Experiment 2, pgbench read / write, huge_pages on # perf record -e dTLB-loads, dTLB-stores -p PID Samples: 832 K of event 'dTLB-load-misses' Event count (approx.): 640614445 Samples: 736 K of event 'dTLB-store -misses' Event count (approx.): 72447300Again, two experiments with pgbench TPC-B workload, the first one was done without huge pages, the second one withhuge_pages=on. Indeed, in the second case we have about 20% less TLD load misses, which correlates good with what we have read in the documentation. No latencies here, just to make a point that we measure just one particular thing, not the whole system, when we can get some noise from other components.
8. BPF
Oh, this famous Buddhist Peace Fellowship! Or was it Berkeley Packet Filter Compiler Collection? What about classic British Pacific Fleet? Sounds like an extended Badminton Players Federation. No idea, decide forYourself. The point is that BPF is conquering the world!
On the serious note, I think it’s important to talk about BPF in this blog post, since it changes rules of our game a bit. What we had before could be described as “stateless tracing / profing”. We’ve got some event, processed it and went for the next one, no state in between. And BPF allows us to do an efficient “statefull tracing / profiling”, which is honestly just mind-blowing.
It’s a bit cumbersome to write plain BPF bytecode, but fortunately there are better ways to do it. Yes, I’m talking about (BCC) , which is not only an amazing tool to generate BPF programs, but also a set of already existing useful scripts. Whileworking with itI’ve got an idea to extend this set by something more Postgres specific and ended up creating an experimentalpostgres-bcc. So what can we do with that?
9. LLC
You can be surprised how important could be last level cache sometimes. But before I was thinking about measuring LLC numbers only globally, e.g. per node. And it was totally mind-blowing for me to realize, that it’s possible to extract LLC numbers and connect them with a backend information. In simplest situations it can give us something like cache misses per query:
# llcache_per_query.py bin / postgres PID QUERY CPU REFERENCE MISS HIT% 9720 UPDATE pgbench_tellers ... 0 2000 1000 50. 00% 9720 SELECT abalance FROM ... 2 2000 100 95. 00% ... Total References: 3303100 Total Misses: 599100 Hit Rate: 81. 86%10. Writeback
Since Postgres is doing buffered IO, it’s quite important to understand writeback behavior under your database. Imagine a situation, when your IO monitoring went crazy without any activity from the Postgres side. At this point we already know, that most likely there are some tracepoints for us.
As an important side note, I need to mention that you actually don’t need to Haveperfto explore all those tracepoints. There is such an amazing tool asftracethat allow us to do a lot without installing anything at all. To try it out mounttracefs(usually it’s already mounted on/ sys / kernel / debug / tracing), pick up an event fromeventsdirectory and enable it.
# cd / sys / kernel / debug / tracing # echo 1>events / writeback / writeback_written / enable # tail trace kworker / u8: 1 reason=periodic nr_pages=101429 kworker / u8: 1 reason=background nr_pages=MAX_ULONG kworker / u8: 3 reason=periodic nr_pages=101457What you see above is a shortened version of the output.MAX_ULONGis a short replacement for maximum unsigned long.

We can see that indeed, Linux kernel starts doing writeback in background trying to flush as much as possible from the filesystem cache. But of course it’s not the whole story, sometimes kernel will make backendswaitif it’s not keeping up with the amount of generated dirty pages. This information we can extract via another script frompostgres-bcc:
# pgbench insert workload # io_timeouts.py bin / postgres [18335] END: MAX_SCHEDULE_TIMEOUT [18333] END: MAX_SCHEDULE_TIMEOUT [18331] END: MAX_SCHEDULE_TIMEOUT [18318] truncate pgbench_history: MAX_SCHEDULE_TIMEOUTIt’s worth noting that one can control writeback behavior via differentparameters, likedirty_background_bytes. Another (possibility) would be to configurebgwriterorcheckpointerviabgwriter_flush_after/ (checkpointer_flush_after) .
11. Memory reclaim
This part requires some context. If you ever faced with Kubernetes, you probably have seen this black magic incantations:
resources: requests: memory:"(Mi ") CPU:"(m ") limits: memory:"(Mi) CPU:"500 m "In this way one can specify an amount of resources an application needs. And now remember that Kubernetes utilize cgroups v1 and we have there:
memory.limit_in_bytes memory.soft_limit_in_bytesWhat would be the first reaction looking at those two examples? Right, they’re not correlated. Well, only partially, since resources memory limit is indeed mapped tomemory.limit_in_bytes. But memory request is actually used only internally e.g. to calculateoom_adjand QoS.
When I discovered this, my idea was that it means there would be no memory reclaim problems, since when an application inside a cgroup goes over a soft memory limit, it starts to reclaim pages. How to prove or disprove this idea? Try it out!
# only under the memory pressure # page_reclaim.py --container 89 c (bb) f [7382] Postgres: 928 K [7138] Postgres: 152 K [7136] Postgres: 180 K [7468] Postgres: 72 M [7464] Postgres: 57 M [5451] postgres: 1mOf course there are a lot of memory reclaims anyway if we come close enough to the memory limit. And indeed we’ve seen such examples when a database inside a K8S pod due to misconfiguration was doing page reclaims too often incurring more overhead. Things are getting more interesting, when we remember that Postgres is using shared memory to keep the data available between different backends. The way how shared memory is implemented is via COW (copy on write) mechanism, and essentially every shared memory page can be duplicated and accounted against cgroup limits. This whole situation introduce more chaos, since Postgres and Linux kernel use and evict those pages using different strategy, so it makes sense to at least check this stuff out from time to time.
By the way, it’s not that straightforward even to run (BCC) on Kubernetes, since most of the time you need to specify an exact Linux kernel version viaBCC_LINUX_VERSION_CODE(eg for the kernels 4. 14. 96 it should be in the format4 * 65536 14 * 256 96) an d Linux headers viaBCC_KERNEL_SOURCE(which you probably need to fake via symlink, in case if headers available in your pod are not matching to the kernel version of the node). Another catch could be if you run on a relatively old kernel versions, since before (v4.) overlayfs does notsupport uprobes
12. IO scheduler
Some time ago it was a common wisdom, that on modern storage devices one need no IO scheduler. Is it still true? Why do I have then so many options here?
# cat / sys / block / nvme0n1 / queue / scheduler [mq-deadline] kyber bfq noneWell, the situation is more interesting that I thought originally. Here is a diagram, inspired byWerner Fischerof something calledblk-mq(Multi-Queue Block IO Queueing Mechanism), which allow us to utilize multi queue storage devices more efficiently:
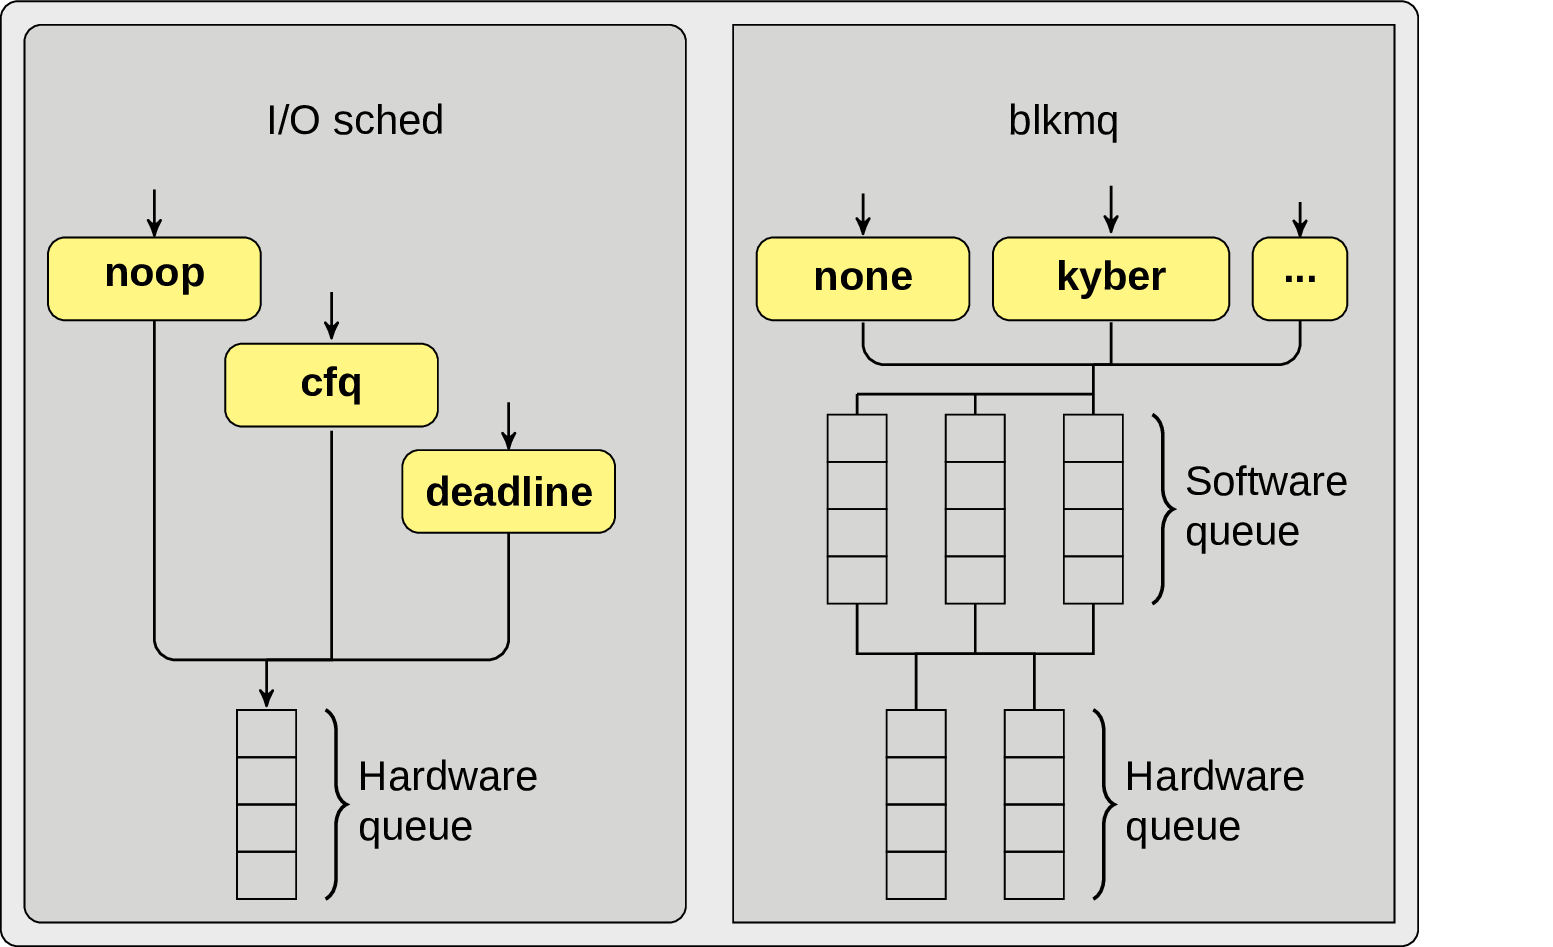
Such IO schedulers asnone,Kyber,MQ-Deadlineare actually implemented via this mechanism and not for nothing. For examplekyberwill try to throttle IO requests by reducing software queues depth in order to meet some predefined target latency. This could be cool e.g. for those cases when there are no mechanisms of IO isolation (hello K8S), and some too greedy applications can skew latencies a lot. But this is just a theory, is there any way to get some practical and measurable knowledge from it? Let’s create a BPF program that will be executed when a new request is inserted into a software queue and completed. Then at the completion event we can check if a completed request was not issued from a cgroup of our interest and there are other requests in the same queue from our cgroup – in this situation we can consider this just completed request a noise for our application, a latency that some other application requests had to wait before they can be successfully executed.
# blk_mq.py --container (C) BB 3133 f latency (us): count distribution 16 ->31 | 32 ->63: 19 | *** | 64 ->127: 27 | **** | 128 ->255: 6 | * | 256 ->511: 8 | * | 512 ->1023: 17 | *** | 1024 ->2047: 40 | ******* | 2048 ->4095: 126 | ********************** | 4096 ->8191: 144 | ************************* | 8192 ->16383: 222 | **************************************** | 16384 ->32767 : 120 | ********************* | 32768 ->65535: 44 | ******* |The example above is pretty artificial, because it was measured only on one software queue (I had to enableblk-mqvia addingscsi_mod.use_blk_mq=1into the Linux boot cmdline), but nevertheless interesting.
13. But… but isn’t it slow?
All this (BCC) stuff is pretty amazing and convenient, but requires to execute some python and compile some generated C code into BPF program via LLVM backend. Sometimes it’s fine, but sometimes an object of your investigation is so overloaded it’s impossible even start python interpreter there. There are some interesting initiatives to overcome this issue, e.g.CORE, but as an interesting experiment I’ve decided to do something similar without havingBCCin place. What do we need to reproduce the same functionality and write a small BPF program to measure latency of a query execution?
Well we need to create an uprobe for whatever event we want to attach to. Sounds Straightforward:
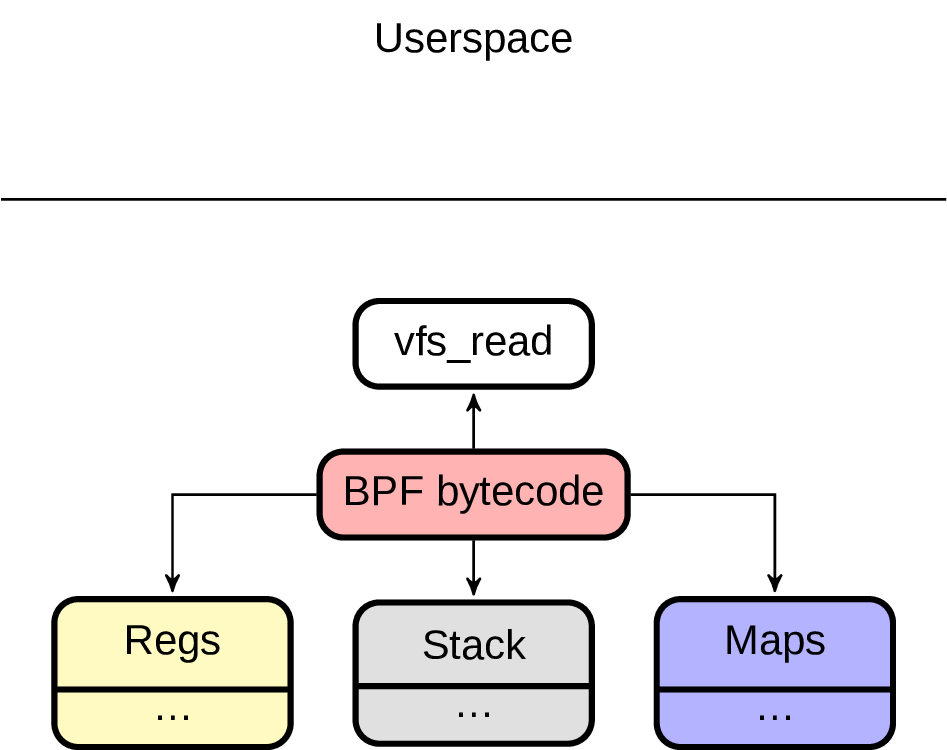
# perf probe -x bin / postgres exec_simple_query # perf probe -x bin / postgres exec_simple_query% return # cat / sys / kernel / debug / tracing / uprobe_events p: probe_postgres / exec_simple_query / bin / postgres: 0x 00 00 00 00 00 44 aa7c r: probe_postgres / exec_simple_query__return / bin / postgres: 0x 00 00 00 00 00 44 aa7cNext step is to write our BPF program in C. For that one can draw some inspiration inlinux / samples / bpf /that contains interesting examples and how to compile them, taking into account you have LLVM and kernel headers installed (make headers_install). In this program we will define a BPF map:
structbpf_map_defSEC("maps"latencies={.type=BPF_MAP_TYPE_HASH,.key_size=Sizeof(U 32),.value_size=Sizeof(U 64),.max_entries=MAX_ENTRIES,};and one function for each uprobe:
SEC("tracepoint / probe_postgres / exec_simple_query")inttrace_enter_open(structsyscalls_enter_open_args*CTX) [k]{u 32key=bpf_get_current_pid_tgid();u 64init_val=bpf_ktime_get_ns();bpf_map_update_elem(&Latencies,&key,&init_val,BPF_ANY) ;return0;}SEC("tracepoint / probe_postgres / exec_simple_query__return")inttrace_enter_exit(structsyscalls_enter_open_args*CTX) [k]{u 32key=bpf_get_current_pid_tgid();u 64*value=bpf_map_lookup_elem(&Latencies,&key);if(value)*value=bpf_ktime_get_ns()-*value;return0;}There was only one catch, somehow it wasn’t working for me for tracepoints, I had to tell that my BPF program is ofBPF_PROG_TYPE_KPROBEtype. If you know why it could be, let me know too:)
The last step would be to actually run and inspect our compiled stuff. To make it more convenient, we can pin our BPF map, so that we can read it from another process:
# mount -t bpf none / sys / fs / bpf # mkdir -p / sys / fs / bpf / maps / # pg_latencies ...And now when it was started successfully, let’s inspect it! For that we can use an amazing tool calledbpftool. Here is our BPF program loaded:
# bpftool prog list 42: Kprobe Tag 9ce 97 A0A 428052 f3 gpl loaded_at 2019 - 11 - (T) : 39: 51 0 100 uid 0 xlated 224 B not jited memlock 4096 B map_ids 54And here is our pinned BPF map:
# bpftool map list 54 : hash name latencies flags 0x0 key 4B value 8B max_entries 1000 memlock 81920 bBut we still have to do something about Linux kernel versions, since we’ve compiled it only for one particular. In fact at this moment our BPF program has something like:
// in hex format value of this section is "2c 130400 "// which can be decoded as 8-bit unsigned integer// 44 (4 0) the version was 4 19 44)u 32_ versionSEC("version")=267052;At this point I’ve got tired and just replaced the corresponding section in the binary with (xxd) :
# new versionFORMAT="{0: 02 x} {1: 02 x} {2: 02 x} {3: 02 x} "VERSION_HEX=$ (Python- c'print (r "'$ FORMAT'' (46, 19, 4, 0)) '')# original versionORIG_HEX="2C 130400 "xxd- ppg_latency_kern.o | sed's /'$ ORIG_HEX'/'$ VERSION_HEX'/'| xxd- p- r>pg_latency_kern_new.oAnd looks like this even works!
Great, but please do this carefully. With a great power comes great responsibility, and before you’ll jump into it, there are few concerns you need
The first one is how much overhead would it mean for your system? E.g.straceis a great tool, but due to how it is implemented it can beQuite slow.perfnormally is faster, but be careful with the disk space consumption, since in some cases (let’s say if you want to trace some scheduler events) it can easily generate gigabytes of data in seconds. BPF by itself is alsopretty fast, but of course if a custom BPF program is doing something too computation expensive, it will slow down your target. As an example,lwlock.pyscript frompostgres-bcc, that tracks Postgres LWLocks, under a heavy lock contended workload could slow down my experimental database to about 30%.
The second concern are potential bugs in a tracing tool itself. It’s not what we see so often to worry too much about it, but from time to time it could happen. I had already such an experience, when due to some strange location of stars on the night sky an old version ofperfcrashed Postgres backend it was attached to, or stuck waiting onuprobe_eventsin a non interruptible mode without any chances to stop or kill it. BPF in this sense it a bit more safe, since the verifier will reject any incorrect BPF programs. So before trying this on production, make sure you’re using a reasonably new version and first experiment on staging (do I even need to say that?).
15. Conclusions
That was the last example I have for today. I hope it was enough to make you at least a bit interested in tracing and profiling your databases, and look deeper into what happens inside and outside. Don’t get me wrong, it’s not like when you runperfor something BPF based any issues will disappear automagically, but you will definitely get more interesting information in your hands.
The magic of the more holistic approach is that it’s useful not only in situations, when your database is wrapped in multiple layers. When you profile a database, most of the time you can trace down precisely what activity or even function have caused this or that problem. E.g. when Postgres is doing unexpectedly too much of IO, one can see in profiles let’s say a lot of full page writes happening at this moment. Looking at this from higher perspective I find it good having a habit to spin upperffrom time to time. Not only it gives you a deeper insight of what happens in your system, but also makes benchmarking more transparent. You need to understand an influence of huge pages on your database? No need to read outdated blog posts, just go and measure it! Why is it important to make benchmarking more transparent? One of the reasons is presented here:
One can reasonably notice that 90% of time, when a database does not deliver expected performance, it’s due to an inefficiently written query or badly designed schema, and this kind of problems we can easily troubleshoot from within Postgres itself without involving any other tools. And this is perfectly correct, but no one said that those two approaches could not work hand by hand. At the end of the day I’m advocating just for an extension of our arsenal, so that when one technique doesn’t help, other will solve a mystery.
And actually I didn’t mention the last reason why one may want to try out this approach – it’s just a lot of fun! When was the last time you had fun hacking something?
Acknowlegements
Thanks a lot to Peter Eisentraut@ petereisentraut), Lorenzo Fontana@ fntlnz) and Franck Pachot (@ FranckPachot) for helping me with proof reading of this text and suggesting various improvements, you rock!


GIPHY App Key not set. Please check settings